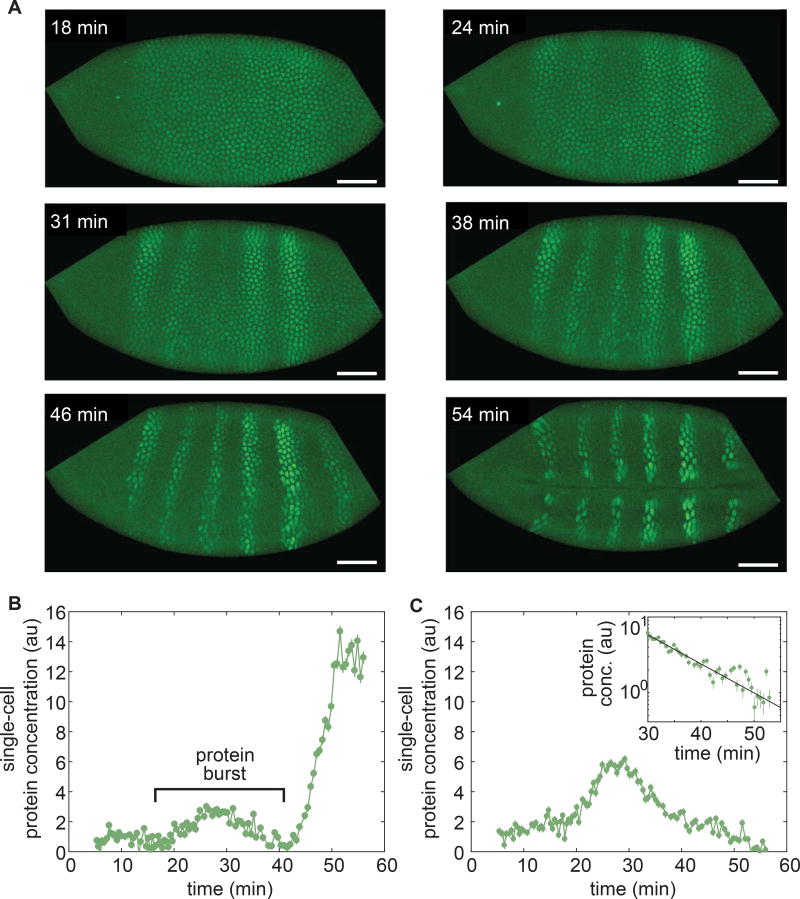
Figure 4. Capturing fast protein production and degradation dynamics using LlamaTags.
(A) Single-embryo, real-time protein expression dynamics of Ftz-LlamaTag. Time is measured with respect to the start of nc14. The field of view is smaller than the embryo, leading to cropping of the images. The embryo is oriented with anterior to the left and ventral on the bottom. The scale bar is 25 µm. (B) Ftz concentration in a nucleus inside a stripe as a function of time suggests the presence of protein bursts. (C) Ftz concentration in a nucleus outside a stripe as a function of time reveals Ftz degradation. Inset, exponential decay fit to Ftz degradation. Averaging fitting results for 58 nuclei yield a half-life of 7.9± 0.9 min. Error bars are standard error of the intensity values within a nucleus. See STAR Methods for further details. See also Movie S3.

