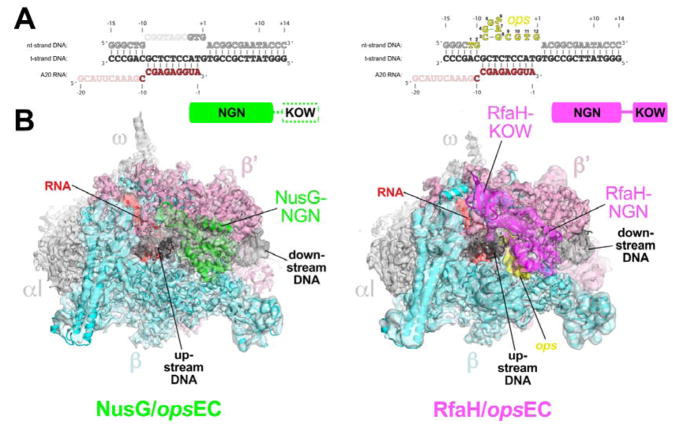
Figure 1. Structures of the NusG-opsEC and RfaH-opsEC.
A. Nucleic acid scaffold sequence used for cryo-EM. The same sequences were used in the NusG-opsEC (left) and RfaH-opsEC (right) structures. Disordered segments in each structure are faded. The nt-DNA ops sequence (nt-DNA −11 to +1, colored yellow for the RfaH-opsEC and numbered according to the ops position) forms a short hairpin that interacts specifically with RfaH but was disordered in the NusG-opsEC (left).
B. The cryo-EM density maps for the NusG-opsEC (left, 3.7 Å nominal resolution, low-pass filtered to the local resolution) and RfaH-opsEC (right, 3.5 Å nominal resolution, but shown is the 3.7 Å nominal resolution map with full-length RfaH, low-pass filtered to the local resolution) are rendered as transparent surfaces and colored as labeled. Superimposed are the final models; proteins are shown as backbone ribbons, the nucleic acids as sticks. The domain organization of NusG (green) and RfaH (magenta) are indicated above. The disordered NusG-KOW is shown in white with a dashed green outline.
See also Tables S1, S2, and Figures S1 – S7.

