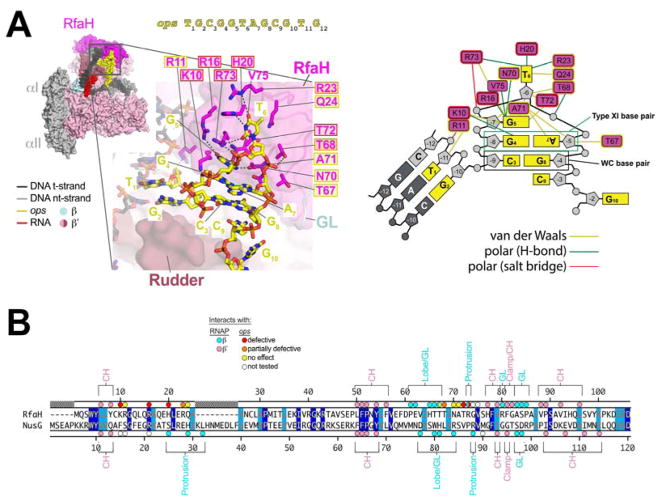
Figure 3. RfaH/ops interactions.
A. (left panel, top) View of the RfaH-opsEC (similar to Figure 2C); the nt-DNA sequence shown on top is numbered according to ops position. Proteins are shown as molecular surfaces. The nucleic acids are shown in CPK format and colored according to the legend. The boxed region is magnified with RfaH rendered transparent, revealing the α-carbon backbone (in cartoon format) and amino acid side chains that interact with ops. Polar RfaH/ops interactions, H-bonds (≤ 3.5 Å) or salt bridges (≤ 4.5 Å) are denoted by gray dashed lines. The ops sequence (yellow) and RfaH (magenta) residues are numbered. The shaded boxes denote the effect of substitutions on RfaH recruitment to ops (red shaded box, defective; orange, partially defective; yellow, no effect; no box, not tested; (Belogurov et al., 2010).
(right panel) Schematic of RfaH/ops interactions. The DNA is color-coded as in (A). The magenta rectangles denote RfaH residues contacting the DNA. Colored lines denote interactions: yellow, van der Waals (≤ 4.5 Å); green, H-bond (≤ 3.5 Å); red, salt bridge (≤ 4.5 Å).
B. Structure-based sequence alignment of the Eco RfaH- and NusG-NGN, numbered above and below, respectively. Identical residues are shaded dark blue, homologous residues light blue. The colored dots on top (RfaH) and bottom (NusG) denote RNAP and ops contacts (color-coded as shown in the legend). The RNAP structural elements that the RfaH (top) and NusG (bottom) residues interact with are noted.

