Fig. 4.

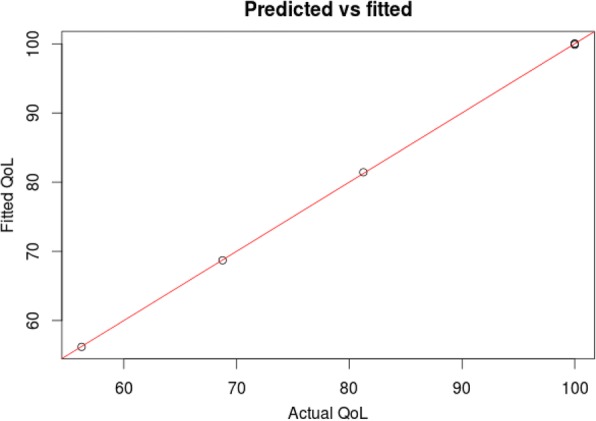
Multiple regression model incorporating patient GAG levels pre- and post-surgery and MMP3 levels post-surgery to predict patient quality of life. The model shows quality of life (QoL) fits with an R2 of 0.9998 and a p value = 0.0087

Multiple regression model incorporating patient GAG levels pre- and post-surgery and MMP3 levels post-surgery to predict patient quality of life. The model shows quality of life (QoL) fits with an R2 of 0.9998 and a p value = 0.0087