
Fig. 4.
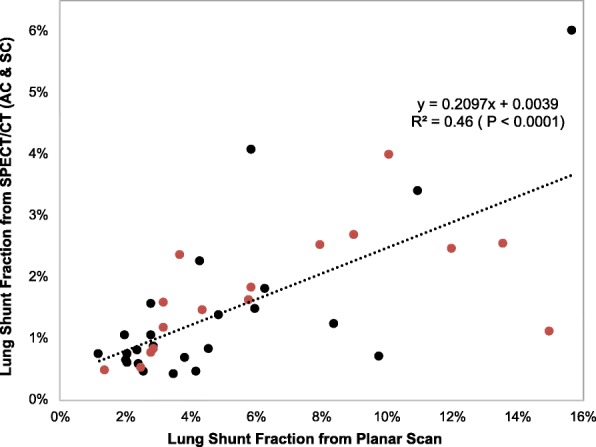
Correlation between planar and SPECT/CT derived lung shunt values for all patients (N = 40). Red symbols correspond to HCC patients, and black symbols correspond to patients with liver metastases
Official websites use .gov
A
.gov website belongs to an official
government organization in the United States.
Secure .gov websites use HTTPS
A lock (
) or https:// means you've safely
connected to the .gov website. Share sensitive
information only on official, secure websites.
Correlation between planar and SPECT/CT derived lung shunt values for all patients (N = 40). Red symbols correspond to HCC patients, and black symbols correspond to patients with liver metastases