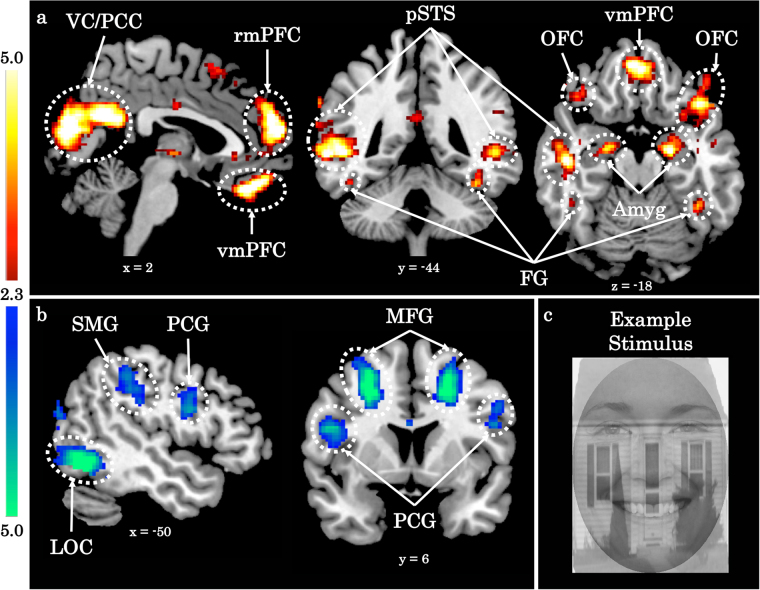
Fig. 1. Participants activate regions of the face perception network when selectively attending to faces.
a, b Z statistic maps of regions showing a significant main effect of the selective attention task, FDR corrected at q < 0.05 and k > 10 voxels. Images are depicted in MNI space and radiological orientation. a Attend Faces > Attend Houses BOLD activity. b Attend Faces < Attend Houses BOLD activity. c An example stimulus. VC visual cortex, PCC posterior cingulate cortex, rmPFC rostromedial prefrontal cortex, pSTS posterior superior temporal sulcus, OFC orbitofrontal cortex, vmPFC ventromedial prefrontal cortex, FG fusiform gyrus, Amyg amygdala, SMG supramarginal gyrus, PCG precentral gyrus, MFG medial frontal gyrus, LOC lateral occipital cortex

