Figure 5.
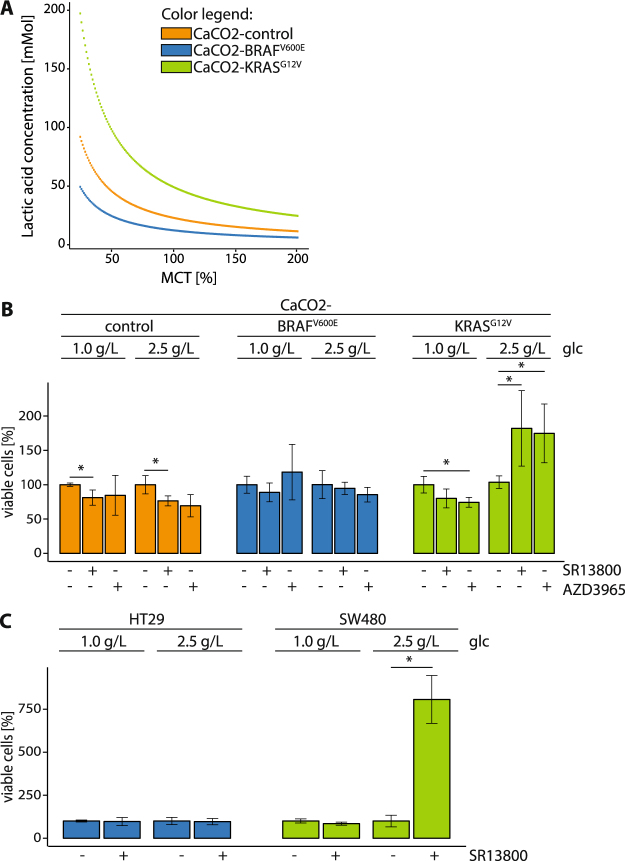
Cells expressing BRAFV600E and KRASG12V are resistant to MCT1 inhibition. (A) Sensitivity analysis of lactic acid concentration depending on the MCT enzyme concentration. The MCT enzyme concentration varies here from 25% to 200% of the fitted value. The model shows how changing the MCT concentration affects the lactic acid accumulation for each cell line model. Low MCT enzyme concentrations result in increasingly large lactic acid concentrations. (B,C) CaCO2-control, CaCO2-BRAFV600E, CaCO2-KRASG12V, HT29 and SW480 cells grown in physiological (1.0 g/L) and intermediate (2.5 g/L) glucose concentrations were treated with 0.1 µM MCT1 inhibitor SR13800 (+), 10 µM AZD3965 (+) or DMSO (−) for 24 h. Viable cells compared to DMSO are depicted. Shown are standard deviation of (in minimum) n = 3 replicates. p < 0.05 was indicated with asterisk (unpaired two-tailed t Test). glc: glucose.

