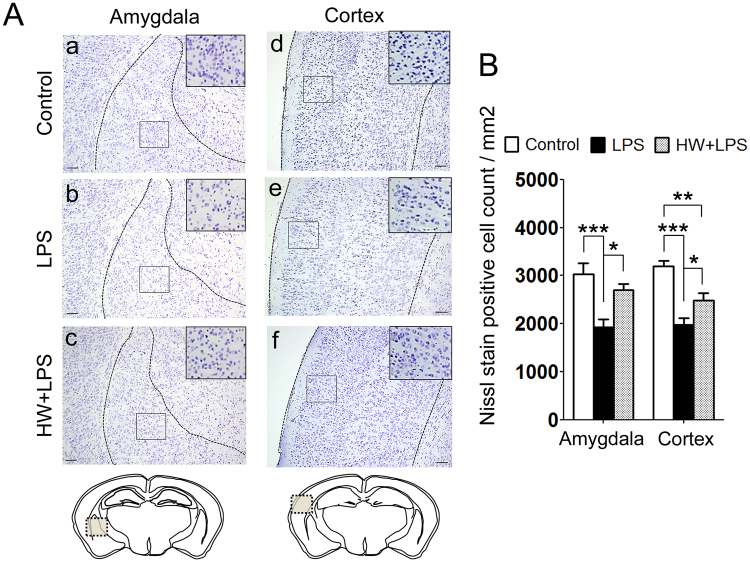
Figure 3.
Effect of H2 on LPS-induced neuronal loss. (A) Representative images of Nissl staining; amygdala and cortex. Scale bar = 100 μm. (B) The quantitation of the number of Nissl-positive cells was performed as described in the Materials and Methods. The result is expressed as the mean ± standard error of the mean (n = 12 in each group). Data are analyzed by one-way ANOVA with Tukey’s honest significant difference test. *p < 0.05, **p < 0.01, ***p < 0.001. LPS, lipopolysaccharide.

