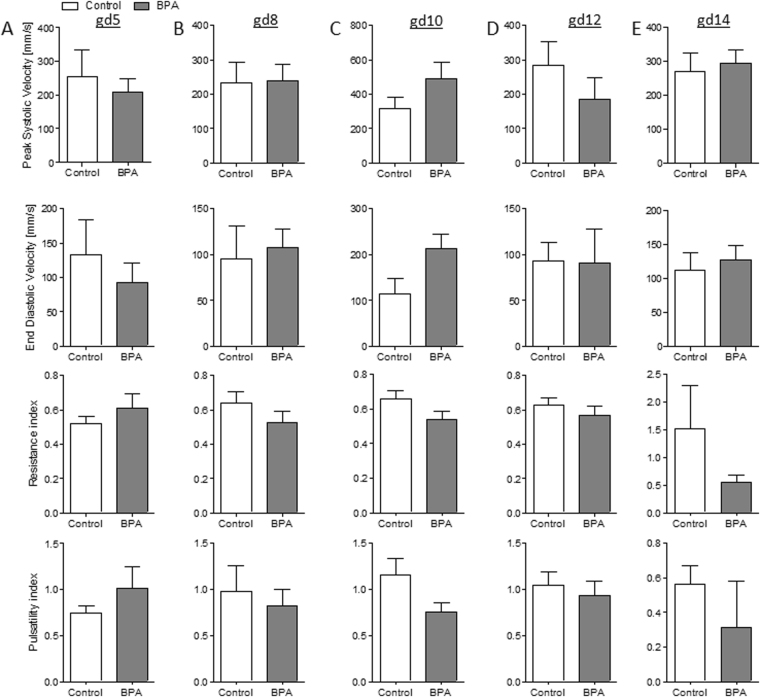
Figure 2.
Comparable maternal uterine artery (UA) velocities in control and BPA-treated mice. Peak systolic velocity, end diastolic velocity, resistance index, and pulsatility index of UAs from C57BL/6J (n = 5) and BPA-treated C57BL/6J (n = 5) mice at gd5 (A), gd8 (B), gd10 (C), gd12 (D), and g14 (E). Data are presented as means with S.E.M. Statistical analysis was performed using the Mann-Whitney-U test. UA, uterine artery; gd, gestation day.

