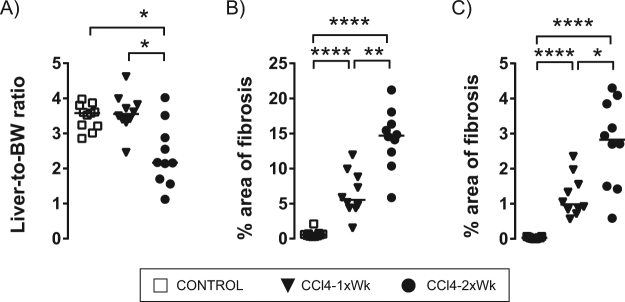
Figure 3.
Changes in liver mass and development of fibrosis. The graphs show the liver-to-body weight ratio (A), and the area of fibrosis (%) evaluated in liver tissue sections stained with (B) Sirius Red or (C) Masson’s Trichrome in rats receiving oral gavage with water (Control group), CCl4 once a week (CCl4-1xWk group) or CCl4 twice a week (CCl4-2xWk) for 12 weeks following the corresponding protocols. Horizontal lines represent the median. *p < 0.05, **p < 0.01, ****p < 0.0001 (ANOVA with Tukey’s post-hoc tests).

