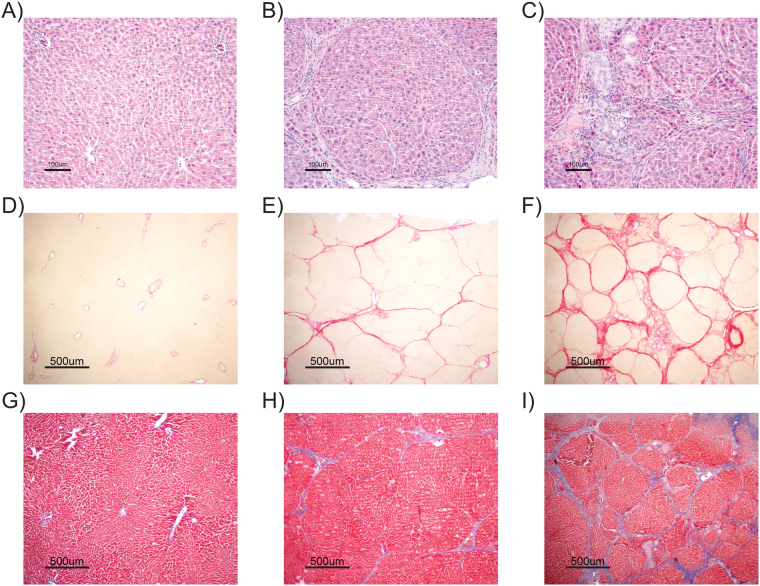
Figure 4.
Representative histological pictures of liver tissue sections stained with (A–C) hematoxylin-eosin (H&E), (D–F) Sirius Red, and (G–I) Masson’s Trichrome. Liver samples were obtained at the termination of the experiments in rats that received (A,D,G) oral gavage with water (Control group), (B,E,H) CCl4 once a week (CCl4-1xWk group) or (C,F,I) CCl4 twice a week (CCl4-2xWk) for 12 weeks following the corresponding protocols. Lines in the lower-left corners represent 100 μmm (H&E staining, 10x objective) or 500 μm (Sirius Red and Masson’s Trichrome staining, 2x objective).

