Fig. 3.

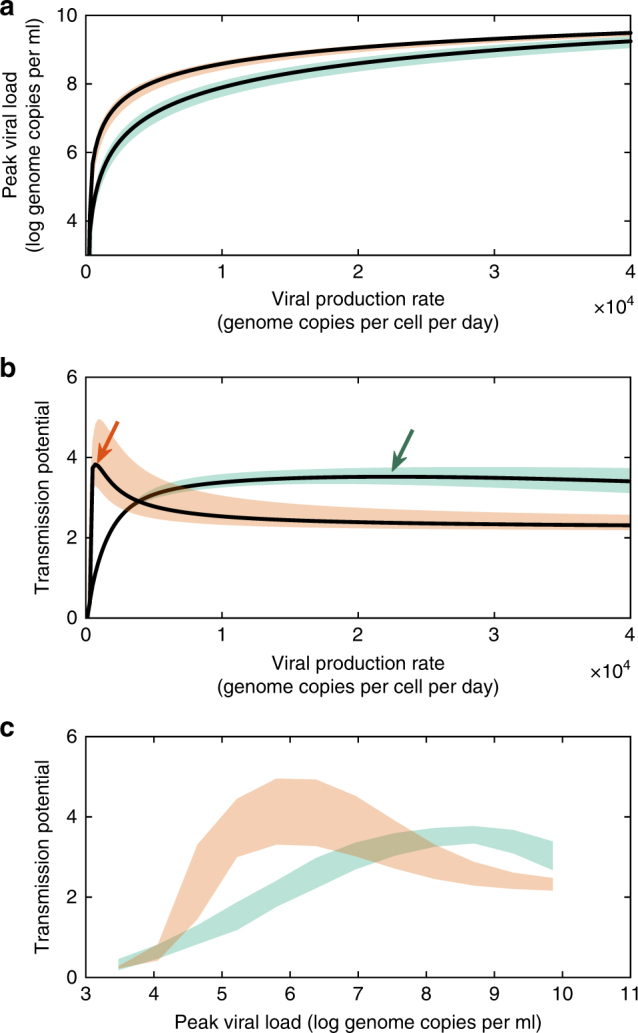
Model-predicted virulence trade-offs for dengue virus. a Model-predicted relationship between the dengue virus production rate and peak viral load, a strong predictor for the risk of developing severe dengue disease. b Model-predicted relationship between the dengue virus production rate and dengue’s transmission potential. Green and orange arrows point to the peaks in transmission potential for primary and secondary infections, respectively. c Model-predicted relationship between peak viral load and dengue’s transmission potential. In a–c, shaded regions show uncertainty estimates, derived from variation in the viral infectivity rate (Methods). Primary infections are shown in green and secondary infections are shown in orange
