
Figure 4.
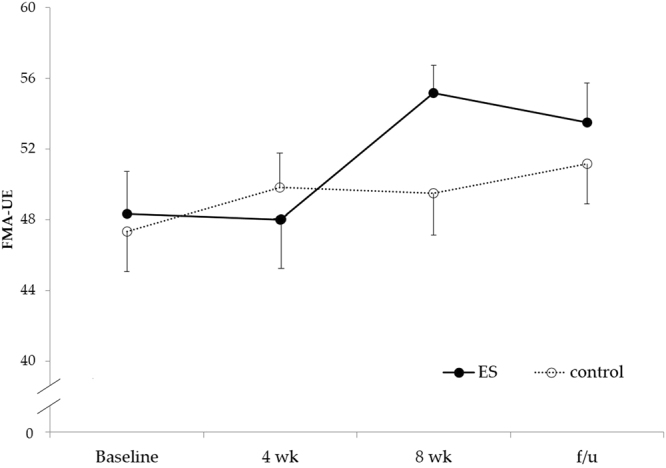
FMA-UE score between the ES and control groups. The data were presented as mean and SE. The FMA-UE scores in ES group at both 8-wk and follow-up had the trend to be higher compared to baseline (p = 0.042 and p = 0.042.) There was no significant change with time in control group. No statistically significance can be found between groups. FMA-UE: Fugl-Meyer Assessment for Upper Extremity; ES: electrical stimulation; 4 wk: 4th week; 8 wk: 8th week; f/u: follow-up.