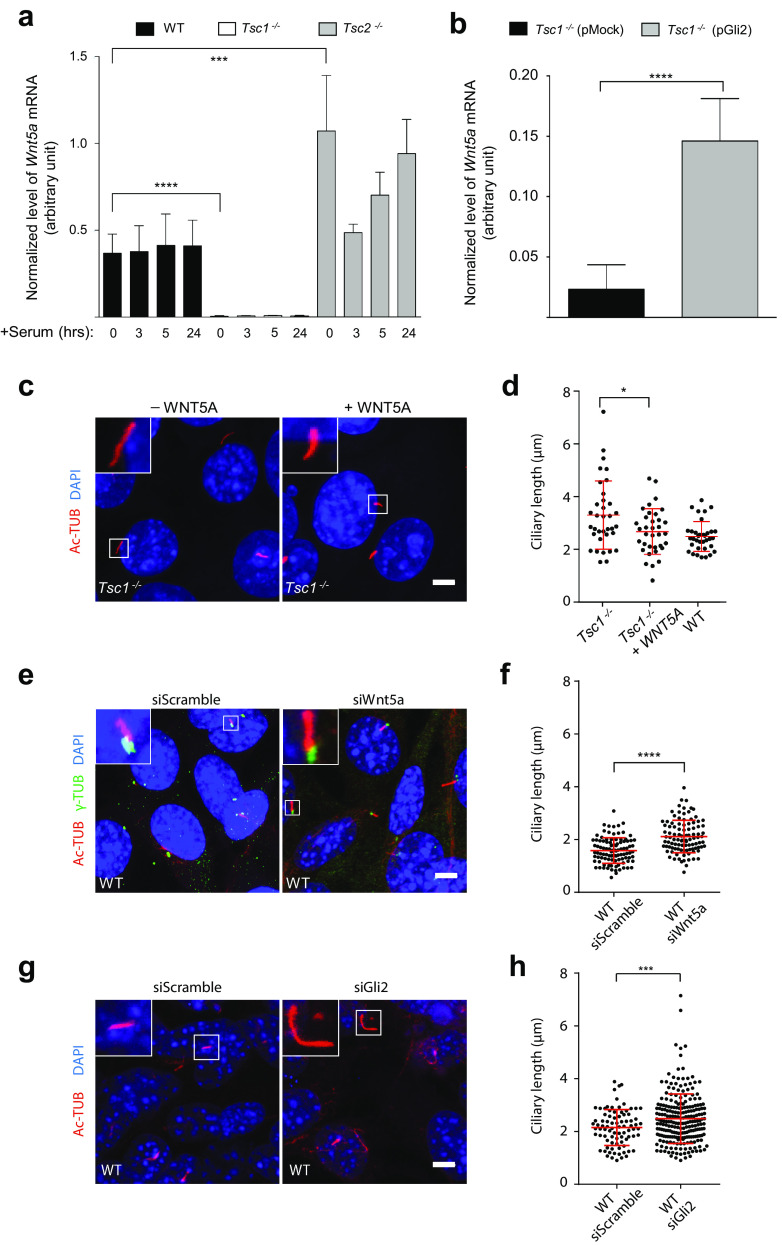
Fig. 6.
Cilia elongation in Tsc1−/− cells is partly abrogated by WNT5a administration. a Normalized expression profiles of Wnt5a mRNA in WT, Tsc1−/− and Tsc2−/− MEFs starved (0.5% FBS) for 48 h followed by serum re-stimulation (10% FBS) for the indicated time points. Error bars represent SEM (n = 3). b Normalized expression profiles of Wnt5a mRNA in Tsc1−/− MEFs transfected with 1 µg plasmid (pMock (empty vector) or pGli2) and cultured in complete medium for 48 h before RNA isolation and qPCR. Error bars represent SEM (n = 3). a, b Expression profiles of Wnt5a were normalized to endogenous Tbp mRNA. c IFM analysis of primary cilia in Tsc1−/− MEFs serum deprived for 48 h in the presence and in the absence of recombinant WNT5A. Cilia were labeled with anti-acetylated α-tubulin (Ac-TUB) antibodies. Nuclei were visualized with DAPI staining. d Quantification of ciliary lengths for experiment shown in c. One hundred cilia from three independent experiments were used for quantification; error bars represent SEM (n = 3). e IFM analysis of primary cilia in WT MEFs transfected with either siScramble or siWnt5a for 24 h followed by serum deprivation for 48 h before analysis. Cilia were labeled with Ac-TUB antibody and the ciliary base/centrosome was labeled with anti-γ-tubulin (γ-TUB) antibody. Nuclei were visualized with DAPI staining. f Quantification of ciliary lengths for experiment shown in e. Three hundred cilia from three independent experiments were used for quantification; error bars represent SEM. g IFM analysis of primary cilia (Ac-TUB) in WT MEFs transfected with either siScramble or siGli2 for 24 h followed by serum deprivation for 48 h before analysis. Nuclei were visualized with DAPI staining. h Quantification of ciliary lengths for experiment shown in g. Two hundred cilia from three independent experiments were used for quantification; error bars represent SEM. Scale bars (c, e, g): 5 µM

