Figure 1.
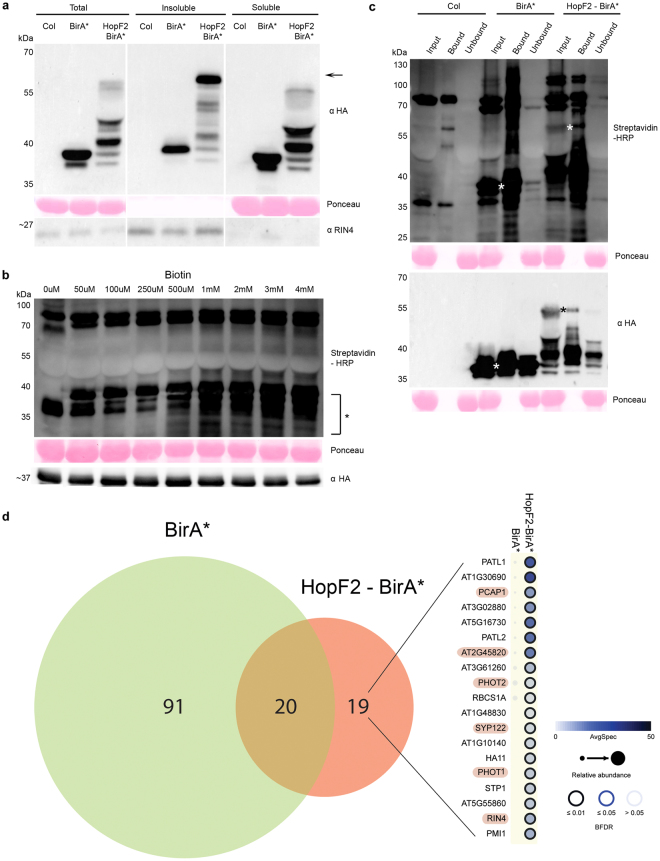
Proximity dependent biotin identification (BioID) in Arabidopsis. (a) Immunoblot of total, insoluble (membrane) and soluble extracts from Col-0 and transgenic plants expressing BirA* (~35 kDa) or HopF2-BirA* (~60 kDa; marked by an arrow) using HA antibody. Extracts were probed with RIN4 antibody as a fractionation control. Ponceau staining is presented as a loading control. Since RuBisCO was not found in the insoluble fraction, RIN4 also serves as a loading control for insoluble fraction. (Note that proteins from the insoluble samples migrated slower on the SDS-PAGE giving them an apparent higher molecular weight, which may be due to differences in sample buffer composition after resuspension of the insoluble pellet (see Methods)). (Note that the images were cropped to show relevant samples and uncropped images are available as Supplementary Information). (b) Immunoblot showing biotin labeling efficiency across concentration gradient (0 μM–4 mM) of exogenous biotin applied to BirA* plants. Biotinylated proteins from total extracts were detected using HRP-conjugated streptavidin. Saturation is most obvious in lower molecular bands (<35 kDa) indicated with an asterisk. HA antibody was used to detect baits in all extracts. (Note that the images were cropped to show relevant samples and uncropped images are available as Supplementary Information). (c) Streptavidin affinity purification of total leaf extracts from Col-0 (parental ecotype), and transgenic plants stably expressing BirA* or HopF2-BirA*, infiltrated with 2 mM exogenous biotin (see Methods). Total protein extract (Input), biotinylated proteins pulled down by streptavidin affinity purification (Bound) and proteins not retained by affinity purification (Unbound) were loaded from each sample. Biotinylated proteins were visualized with HRP-conjugated streptavidin (top panel) and bait expression monitored using HA antibody (bottom panel). Expected bait proteins are marked by asterisks* on the Streptavidin-HRP blot and HA blot. (Note that the images were cropped to show relevant samples and uncropped images are available as Supplementary Information). (d) Venn Diagram showing the number of significant preys identified in BirA* or HopF2-BirA* across two independent biological replicates relative to three biological replicates of Col-0 (BFDR ≤ 0.01). Preys unique to HopF2-BirA* bait are visualized on the right side as a dot plot, which shows list of preys on the y-axis and its interacting baits on top22,23. Simply, the color of the dot represents the average spectral counts of identified prey, the size of the dot reflects the relative abundance of a prey across two baits, and the edge colour indicates the BFDR value associated with each bait-prey interaction (see legend). Preys known to be involved in plant immunity are highlighted in pink.

