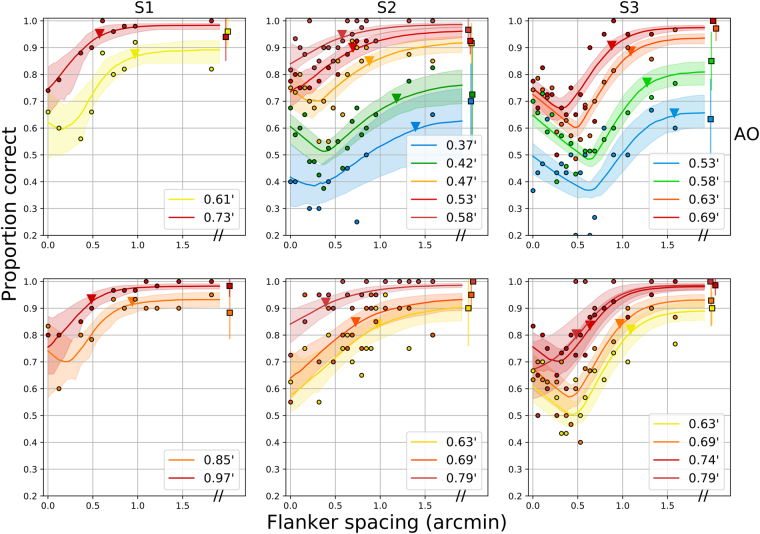
Figure 5.
Entire data set for the 3 observers, with fits from model #5. The top row shows AO results, while the bottom row shows low-order optical correction. 95% confidence intervals are shown for unflanked trials (rightmost squares), representative of confidence intervals for the other data points. Colors indicate the size of a stroke, as indicated in the figure legends. Lines and shaded regions show model fits and 95% confidence intervals for each optotype size, which have been inverse transformed from the probit model. Triangles near each function indicate the fitted critical spacings for a reduction of 2.5% accuracy performance.

