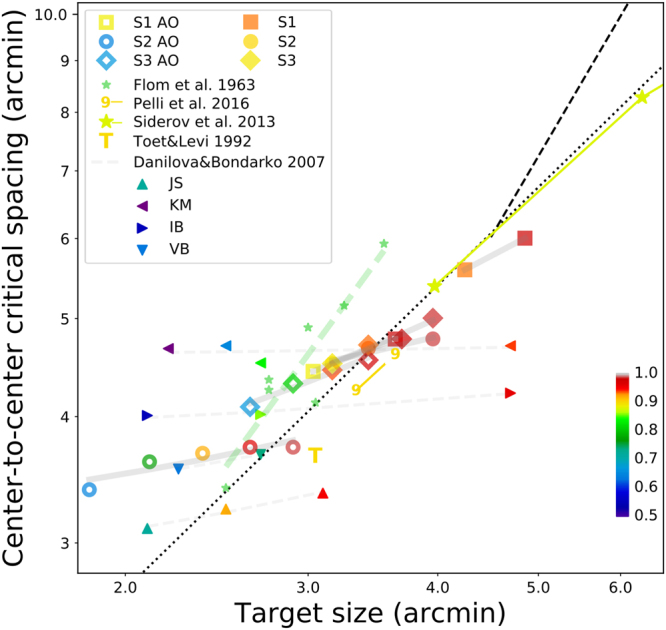
Figure 6.

Summary figure plotting center-to-center critical spacing versus target size for our results and relevant results from the literature. Each marker type represents a study or individual observer. The color of each symbol indicates the asymptotic (unflanked) performance level, as shown by the colorbar. Gray and colored lines connect results from a single study (or observer from a study). Black dotted line indicates proportional regime (CS = 1.4 × size) for ~90% correct).
