Fig. 2.
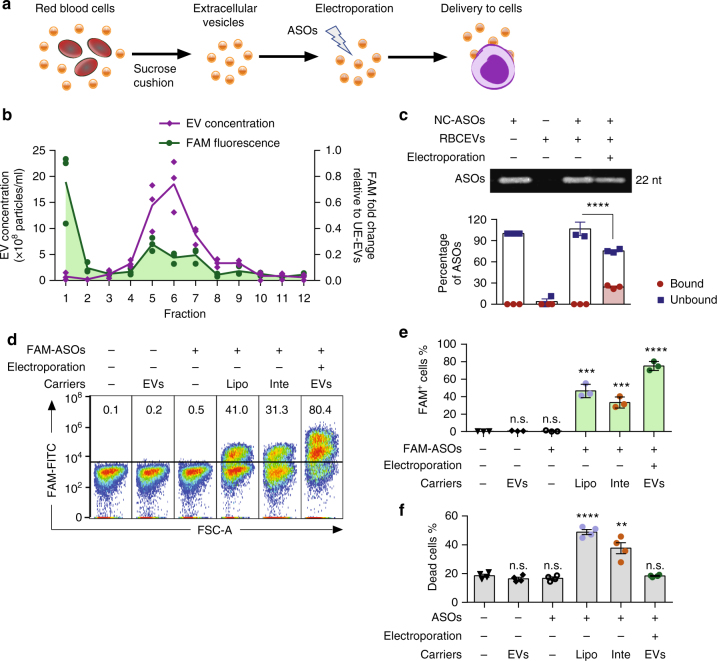
Electroporation of RBCEVs with ASOs and delivery to leukemia cells. a Experimental scheme of ASOs delivery by RBCEVs. b Average concentration of EVs (200× dilution) and average fold change in FAM fluorescent intensity relative to unelectroporated EVs (UE-EVs) of 12 fractions in a sucrose gradient separation of RBCEVs electroporated with a FAM-labeled scrambled negative control ASOs (FAM-NC-ASOs), determined using a Nanosight analyzer and Synergy fluorescent microplate reader, respectively, n = 3 repeats. c Separation of unbound NC-ASOs (unlabeled) from 8.25 × 10¹¹ unelectroporated or electroporated RBCEVs compared to the untreated NC-ASOs (200 pmol) in 10% native gel, visualized using SYBR Gold staining (top) and the average percentage of NC-ASOs unbound or bound to electroporated RBCEVs (bottom), n = 3 independent replicates. d FACS analysis of FAM fluorescence vs. forward scatter area (FSC-A) in MOLM13 cells transfected with 400 pmol FAM-NC-ASO using LipofectamineTM 3000 (Lipo), INTERFERin® (Inte) or 12.4 × 10¹¹ RBCEVs. Percentages of FAM-positive cells are indicated above the gate. e Average percentages of FAM+ cells among viable MOLM13 cells transfected or treated with RBCEVs containing FAM ASOs as in d, n = 3 repeats. f Percentages of dead cells determined by propidium iodide staining among MOLM13 cells transfected or treated with RBCEVs containing unlabeled NC-ASOs, n = 4 repeats. All graphs present mean ± SEM. Student’s one-tail t-test results are shown as n.s. non-significant; **P < 0.01; ***P < 0.001 and ****P < 0.0001 relative to the unelectroporated control (c) or to the untreated control (e, f)

