Fig. 6.
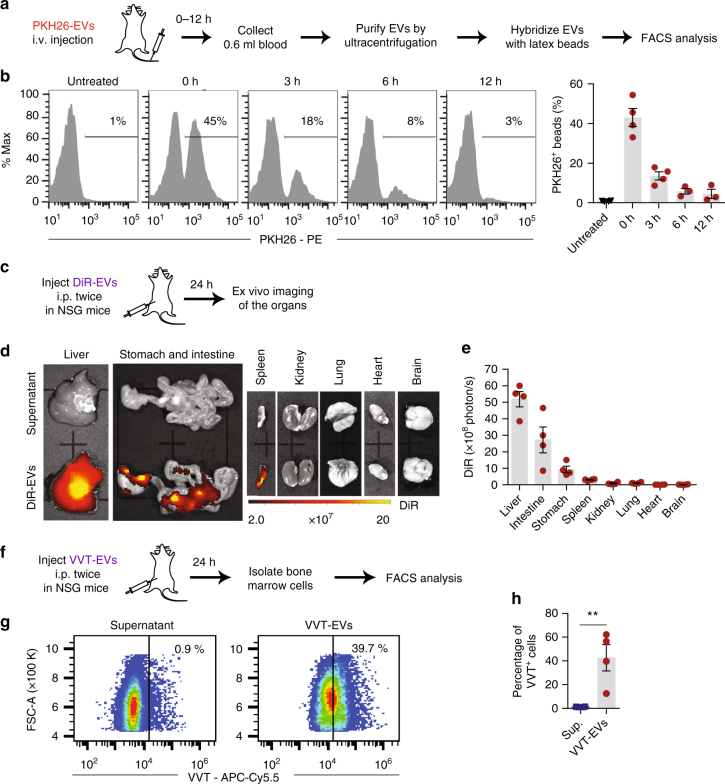
Biodistribution of RBCEVs upon systemic administration in NSG mice. a Experimental schema for determination of RBCEV circulation time following an i.v. injection. b FACS analysis of PKH26 fluorescence on the beads that were bound to total EVs from the blood of NSG mice immediately (0 h) or 3, 6, 12 h after the i.v. injection of 3.3 × 10¹² PKH26-labeled RBCEVs. The percentage of PKH26-positive beads are shown above the gate and the average is shown in the bar graph (mean ± SEM; n = 3 or 4 mice in two repeats). c Experimental schema for determination of RBCEV biodistribution in NSG mice. d Representative images of the organs 24 h after 2 i.p. injections (24 h apart) of 3.3 × 10¹² DiR-labeled RBCEVs or the supernatant from the last wash of labeled EVs. Images were captured using IVIS. DiR fluorescence is shown in pseudocolored radiance. e Average DiR radiance in the organs of the mice injected with DiR-labeled RBCEVs (mean ± SEM; n = 4 mice in 2 repeats). f Experimental schema for determination of vivotrack-680 (VVT)-labeled RBCEV distribution to the bone marrow in NSG mice. g FACS analysis of VVT fluorescence (APC-Cy5.5) vs. FSC-A of bone marrow cells from the mice 24 h after 2 i.p. injections (24 h apart) of 3.3 × 10¹² VVT-labeled RBCEVs or the EV wash supernatant (Sup). h Average percentage of VVT-positive cells (mean ± SEM, n = 4 mice in 2 repeats). **P < 0.01, one-tail Mann–Whitney test

