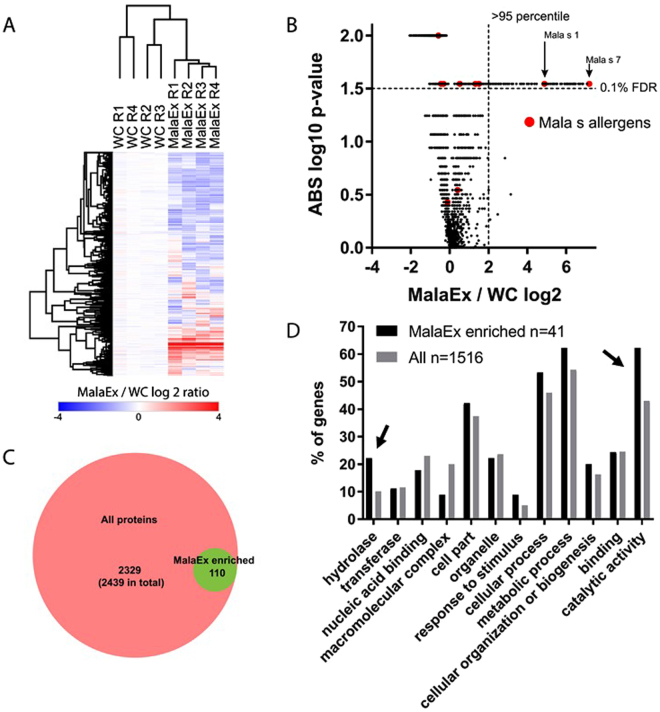
Figure 2.
Characterizing MalaEx proteins by proteomics. (A) Quantitative overview of iTRAQ based proteomics experiments to define MalaEx enriched proteins by comparing MalaEx to M. sympodialis whole cells (WC). R 1–4 denotes the 4 biological replicates cultured for 72 h in mDixon broth, and 2439 proteins with quantification across all 8 samples are shown. (B) Volcano plot to define proteins enriched in MalaEx compared to WC. Proteomics data as in (A). Vertical and horizontal dashed lines indicate 95 percentile of ratios and q-value < 0.1, respectively. Mala s allergens are indicated in red. (C) Venn diagram depicting overlap between proteins considered enriched in MalaEx compared to WC. (D) Gene ontology (GO) analysis of MalaEx. GO term distribution in proteins defined as enriched in MalaEx (from A–C) compared to all identified proteins. Numbers indicate the number of M. sympodialis proteins that could be mapped to yeast homologs for the analysis. Arrows highlight proteins most enriched in MalaEx.

