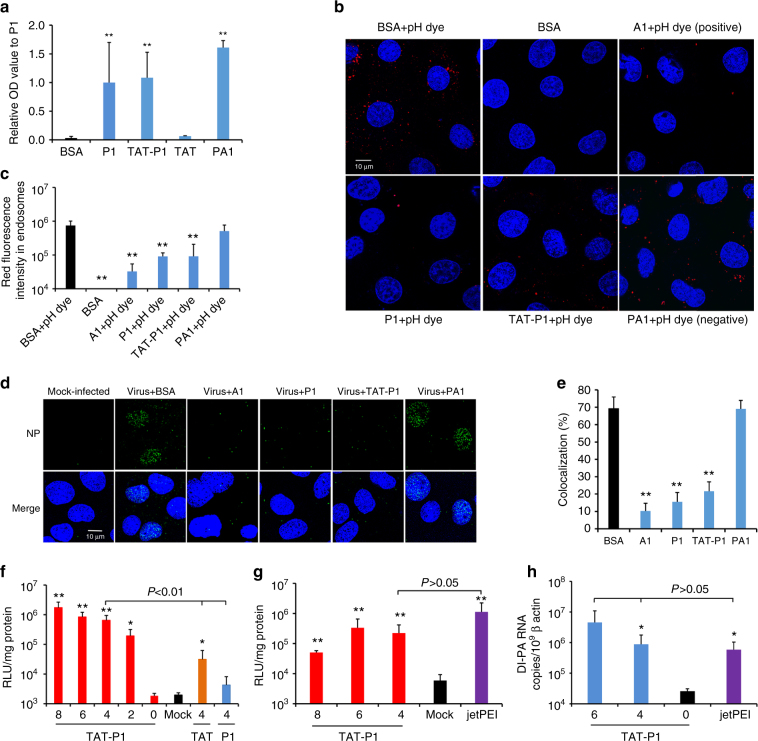
Fig. 4.
The antiviral mechanism and transfection efficiency of TAT-P1. a P1 and TAT-P1 could bind to H1N1 glycoprotein HA1 in an ELISA assay. OD values were normalized to P1 as 1. ** Indicates P < 0.01 when compared with BSA. b P1 and TAT-P1 could prevent endosomal acidification. Red dots (pHrodoTM dextran) indicate pH lower than 6.0 in endosomes. P9-aci-1 (PA1), which did not prevent endosomal acidification, was a negative peptide control for P1. Blue color indicates nuclei. Live cell images were taken by confocal microscope (original magnification ×400, scale bar = 10 μm). c The quantification of red fluorescence of endosomal acidification in MDCK cells when cells were treated by BSA, bafilomycin A1 (A1), P1, TAT-P1, or PA1 corresponding to b. Ten microscope fields of each sample were included for quantification. ** Indicates P < 0.01 when compared with BSA + pH dye group. d P1 and TAT-P1 could prevent viral RNP release into nuclei. MDCK cells were infected with 1 MOI of A(H1N1) virus treated with or without drugs. Images of NP (green) and nuclei (blue) were taken at 3.5 h post infection (scale bar = 10 μm). e Percentages of NP colocalized to nuclei. The SD was determined from multiple microscope fields including ~ 200 cells for each sample. ** Indicates P < 0.01 when compared with BSA. f Transfection efficiency of peptide/pLuc in 293T cells. Numbers indicate weight ratios of corresponding peptide:pLuc. Mock means cells treated with TAT-P1 without DNA. Data were presented as mean ± SD of three independent experiments. g Transfection efficiency of pCMV-Luc transfected by TAT-P1 or jetPEI in mouse lungs. Luciferase expression in mouse lungs was normalized to 1 mg protein. Mock means mice treated with TAT-P1 or jetPEI without DNA. h Transfection efficiency of plasmid of DI-PA transfected by TAT-P1 or jetPEI in mouse lungs. Data were presented as mean ± SD of ≥3 mice in each group. * Indicates P < 0.05. ** Indicates P < 0.01 when compared with Mock in f and g or when compared with “0” (naked DNA) in h. P values were calculated by the two-tailed Student’s t test

