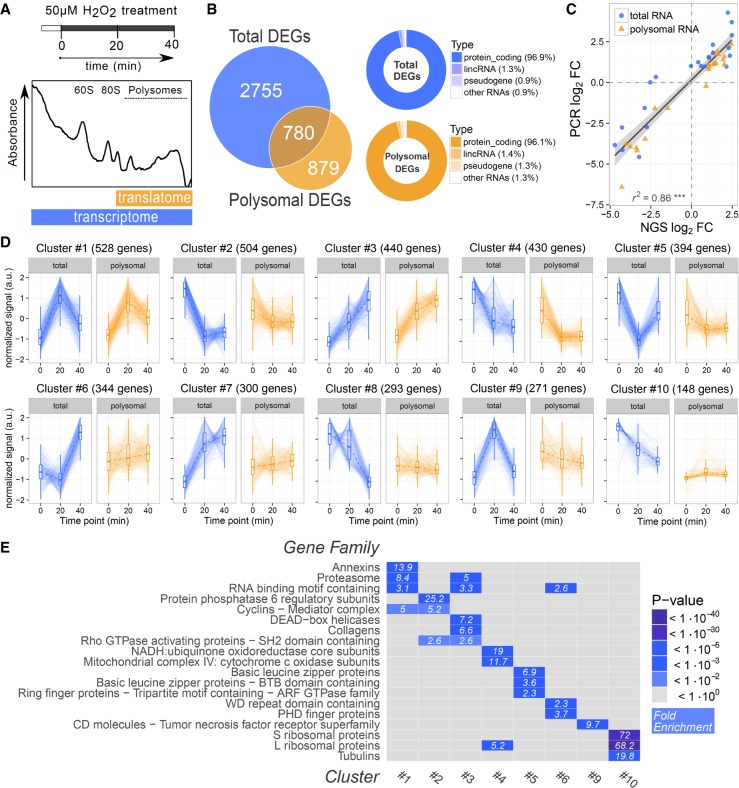
FIGURE 1.
RNA-seq and POL-seq of SC upon H2O2 treatment reveal specific coregulation of gene families. (A) Scheme of polysomal profiling of primary SC isolated from rat sciatic nerves and treated with 50 µM H2O2 for 20 and 40 min. (Bottom) Representative sucrose gradient profile highlighting the fractions used for the preparation of polysomal and total RNA libraries, respectively. (B, left) Venn diagram showing the number of differentially expressed genes (DEGs) specifically or commonly identified in transcriptome and translatome profilings. (Right) Donut charts representing the RNA class composition of total and polysomal DEGs. The majority (96%) of identified DEGs are protein coding transcripts. (C) Scatter plot comparing NGS and qPCR results on a set of 11 differentially expressed genes upon H2O2 treatment. The significant coefficient of determination, as calculated by linear regression, demonstrates the high level of agreement between the two techniques. Both total RNA (circle) and polysomal RNA (triangle) data are shown. (D) Cluster analysis of DEGs. Clusters were identified based on expression correlation values using the affinity propagation method. Clusters were ranked by decreasing size, and the ten clusters with more than 100 genes are displayed. Each plot represents the total and polysomal expression trajectories of the single genes belonging to the cluster, together with the cluster median (dotted line) and summary statistics (boxplot). (E) Heat map displaying gene family enrichment analysis on cluster of DEGs. For each cluster shown in panel D, the top enriched gene families are shown. Significant enrichments are displayed in blue shades, with the corresponding fold enrichment value indicated in each tile.

