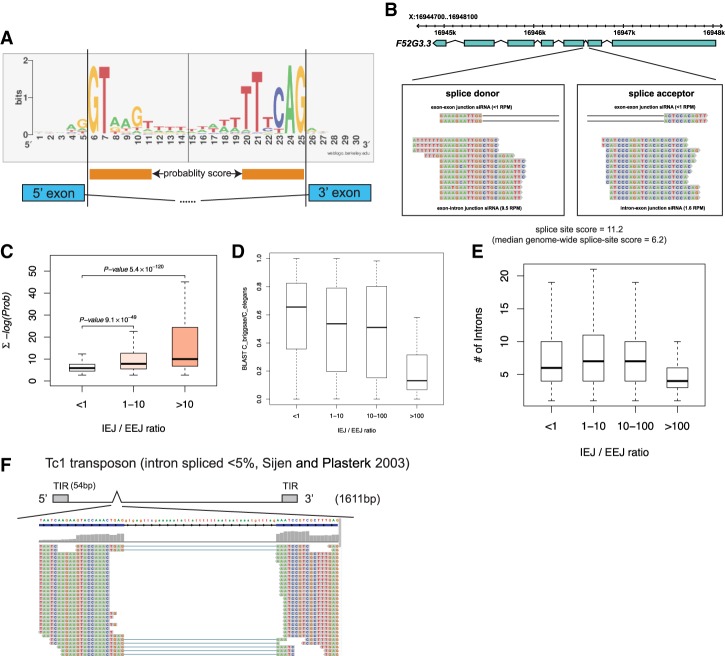
Figure 5.
siRNA densities across spliced and unspliced junctions as a function of splice site quality, intron number, and gene conservation. (A) Logo diagram depicting the most frequently occurring bases at and proximal to the splice donor and acceptor sequences averaged across all C. elegans introns. Orange bars below the logo diagram represent the bases that were used to calculate divergence from both splice donor and acceptor sequences. (B) F52G3.3 is an example of a poorly conserved gene for which the second (highly divergent) intron generates abundant IEJ siRNAs. (C) Genome-wide analysis of splice site scores of all introns (Y-axis) versus the ratio of IEJ to EEJ siRNAs. Note that poor splice site quality scores (a high number) track with more siRNAs generated across splice sites (IEJ siRNAs). (D) The box/whisker plot is similar to that in C, but the Y-axis is the conservation of all genes between C. elegans and Caenorhabditis briggsae calculated using BLAST scores. Note that poorly conserved genes generate more siRNAs across splice sites (IEJ siRNAs). (E) IEJ/EEJ versus intron number genome-wide. (F) Small RNAs that map to the vicinity of the Tc1 transposon intron are displayed; the Tc1 gene structure is depicted above the small RNA reads.

