Figure 5.

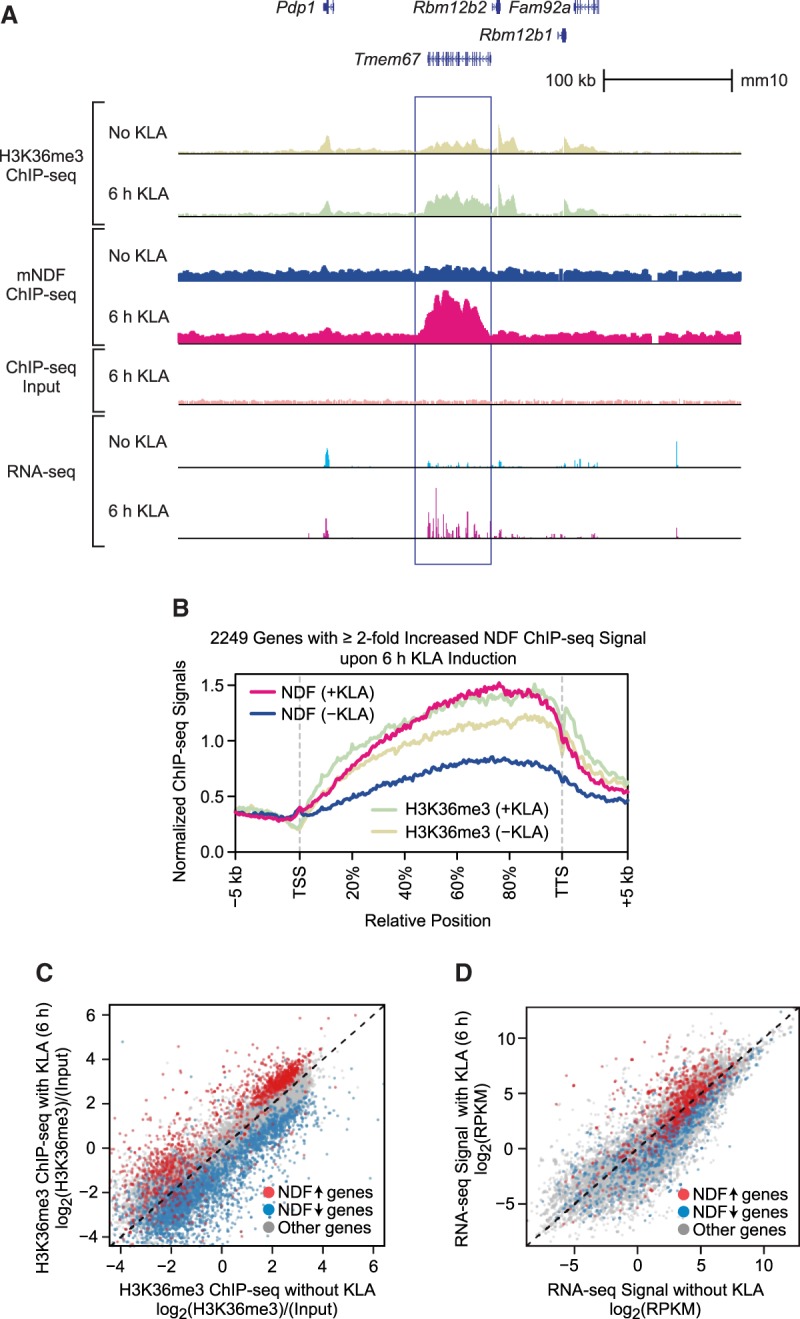
NDF is recruited to the transcribed regions of thousands of genes in mouse primary BMDMs upon transcriptional induction by KLA. (A) Genome browser view of H3K36me3 ChIP-seq, mNDF ChIP-seq, and RNA-seq with or without induction by KLA for 6 h. The region in the vicinity of the Tmem67 gene is indicated by the box. (B) Recruitment of mNDF to gene bodies upon activation of BMDMs by KLA. Metagene analysis of NDF and H3K36me3 ChIP-seq signals at 2249 genes in which NDF occupancy increases by at least twofold upon 6 h of induction with KLA. (C) The KLA-induced increase in NDF occupancy correlates with an increase in H3K36me3. The scatter plot (35,933 total genes) shows 2249 genes in which NDF occupancy increases (up arrow) by at least twofold upon KLA induction for 6 h and 4097 genes in which NDF occupancy decreases (down arrow) by at least twofold upon KLA induction for 6 h. (D) The KLA-induced increase in NDF occupancy generally correlates with an increase in transcript levels. The genes at which NDF levels change upon KLA induction are as in C.
