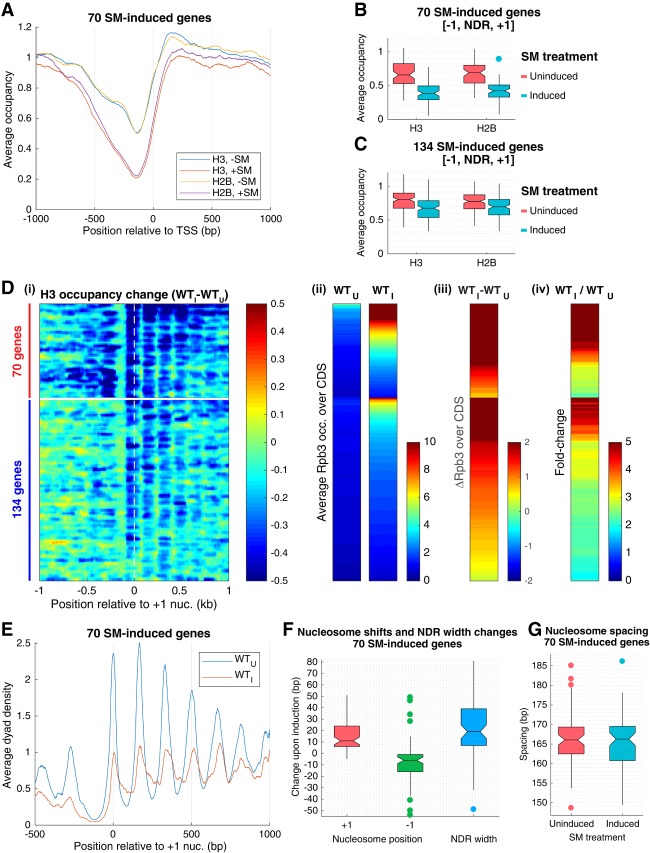
Figure 1.
Promoter nucleosomes are disassembled and repositioned on SM-induced transcriptional activation. (A) Plots of H3 and H2B occupancies at each base pair, normalized to the average occupancy on the respective chromosome for each gene, calculated from ChIP-seq data of sonicated chromatin, averaged over the 70 SM-induced genes, and aligned to the TSS. (Blue and yellow) WT_U; (red and purple) WT_I. (B,C) Notched box plots of H3 and H2B occupancies per nucleotide in the [−1,NDR,+1] region calculated from ChIP-seq data of sonicated chromatin from at least three replicates of WT_U and WT_I cultures for 70 SM-induced genes (B) and 134 SM-induced genes (C). If the notches of two plots do not overlap, there is 95% confidence that the true medians of the two distributions differ. Each box depicts the interquartile range containing 50% of the data, intersected by the median; the notch indicates a 95% confidence interval (CI) around the median. (D) Heat map depictions of changes in H3 or Rpb3 occupancies upon SM induction of wild-type cells (WTI vs. WTU) calculated from MNase (H3) or (Rpb3) ChIP-seq data for the 204 SM-induced genes, divided between 70 (top) and 134 (bottom) SM-induced genes, and sorted by induced Rpb3 levels for each group. (Panel i) H3 occupancy differences relative to the +1_Nuc dyad. (Panel ii) Rpb3 occupancies averaged over the CDSs in WTU and WTI cells. (Panel iii) Differences in Rpb3. (Panel iv) Rpb3 induction ratios between WTI and WTU cells for the same gene order, color-coded as shown at the right of each panel. (E) Average dyad density from MNase-ChIP-seq data aligned to the +1_Nuc for 70 SM-induced genes. Midpoints (dyads) of nucleosomal size sequences between 120 and 160 bp were determined with respect to the +1_Nuc and summed for 70 genes. Average profiles were smoothed using a moving average filter with a span of 31 bp. The data were normalized internally to the average value for each data set. (F) Box plots depicting shift in +1_Nuc and −1_Nuc positions and change in NDR width for 70 SM-induced genes, calculated from H3 MNase-ChIP-seq data by calculating change in dyad peak position in WTI versus WTU cells for the +1_Nuc and −1_Nuc, respectively. (G). Box plots depicting nucleosome spacing for 70 SM-induced genes in SM-induced or uninduced wild-type cells for the array of +1_Nuc to +5_Nuc, calculated from H3 MNase-ChIP-seq data.

