Figure 5.
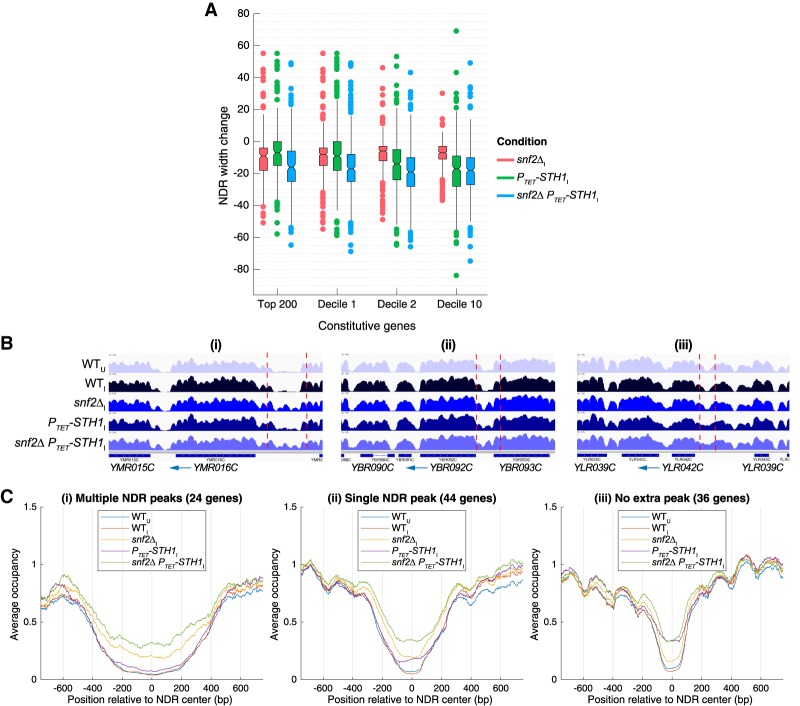
SWI/SNF and RSC cooperate in NDR widening and blocking nucleosome formation in NDRs of highly expressed genes. (A) Notched box plots of changes in NDR widths calculated from H3 MNase-ChIP-seq data for the indicated strains, the top 200 constitutive genes, and indicated deciles of 3619 constitutive genes as in Figure 4B. (B) Integrated Genomics Viewer (IGV) tracks depicting H3 occupancies from MNase-ChIP-seq data in genomic regions surrounding YMR016C (panel i), YBR092C (panel ii), and YLR042C (panel iii) genes in the indicated yeast strains/conditions. Vertical dashed lines demarcate NDRs discussed in the text. (C) Plots comparing normalized and averaged H3 occupancies from MNase-ChIP-seq reads aligned to the NDR center for constitutive genes selected for exhibiting nucleosome peaks within NDRs in snf2Δ PTET-STH1 cells, plotted separately for subsets of genes displaying multiple (panel i) or single (panel ii) nucleosome peaks in NDRs or NDRs filling without nucleosome peaks (panel iii).

