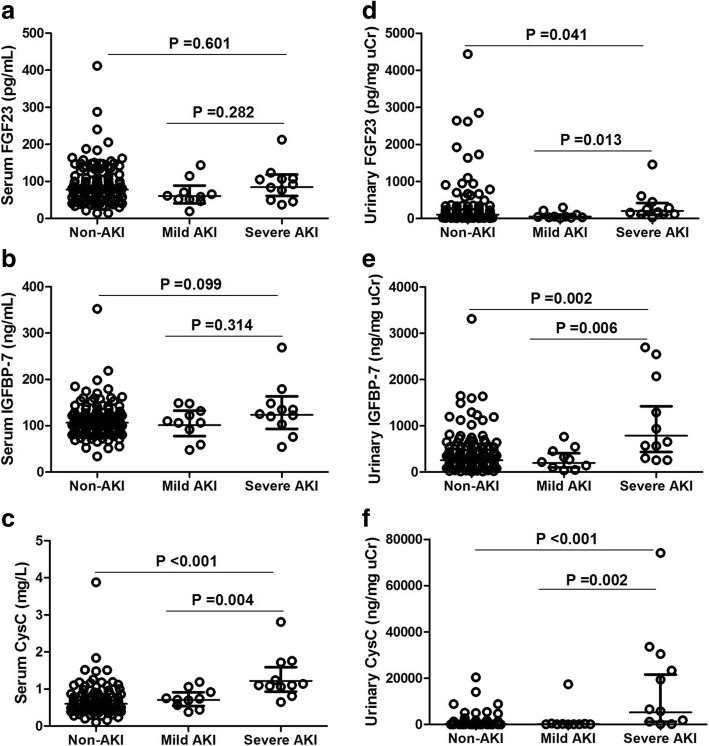
Fig. 1.
Comparison of the levels of biomarkers among critically ill children with non-AKI, mild AKI, and severe AKI. a serum level of FGF23, b serum level of IGFBP-7; c serum level of CysC, d urinary level of FGF23, e urinary level of IGFBP-7, f urinary level of CysC. AKI network stage 1 was defined as mild AKI. AKI network stages 2 and 3 were defined as severe AKI. Each circle represents an individual patient; the horizontal lines indicate geometric means with 95% confidence interval. Probability values: the Mann-Whitney U test. The P value for comparison between non-AKI (n = 123) and severe AKI (n = 11), and for comparison between mild (n = 10) and severe (n = 11) AKI

