
Fig. 2.
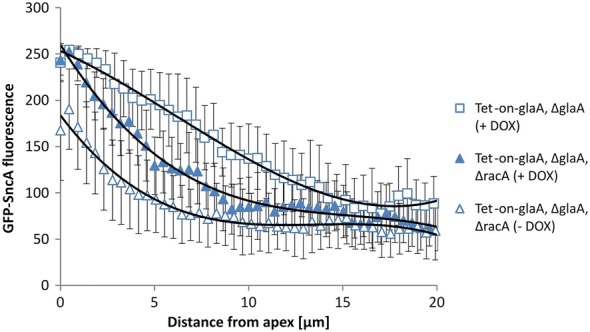
Polynomial curve approximation of distribution of secretory vesicles in both wildtype and hyperbranching (∆racA) backgrounds. Approximation of vesicle distribution for ∆racA (Tet-on-glaA, ∆glaA, ∆racA; MF22.4) and its parental strain (Tet-on-glaA, ∆glaA; MF19.5) under glaA overexpression conditions (+DOX) with a polynomial curve of the third order using an Excel trendline function. Both strains express the GFP-SncA fusion. Curves are taken from Fig. 1