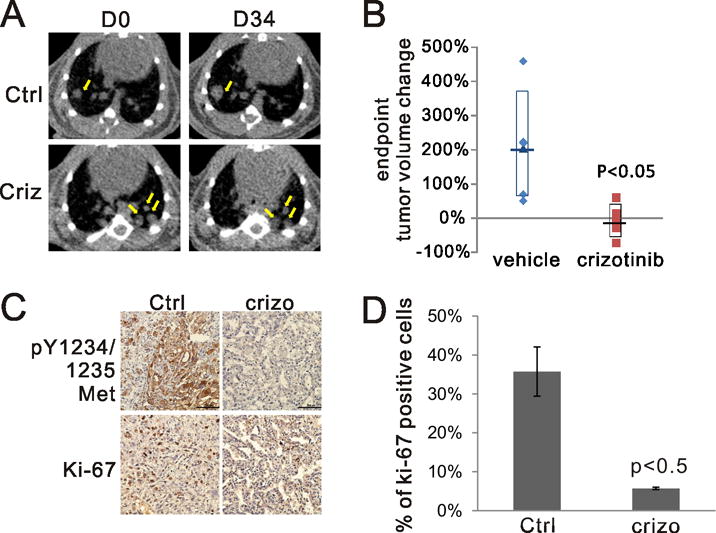
Figure 5.

A) Representative microCT scans of mice receiving vehicle or crizotinib at the beginning (D0) and the end of treatment (D34). Yellow arrows point to representative tumor areas. B) The change of tumor volume reconstructed from microCT. % volume change= (D34 –D0)/D0 × 100%. C) Representative immunohistochemistry of lungs from vehicle or crizotinib treated groups stained with antibodies against the indicated proteins. Ctrl: vehicle treated, crizo: crizotinib treated. D) Quantification of Ki-67 positive cells from (C). Tumors from two mice for each group were evaluated.
