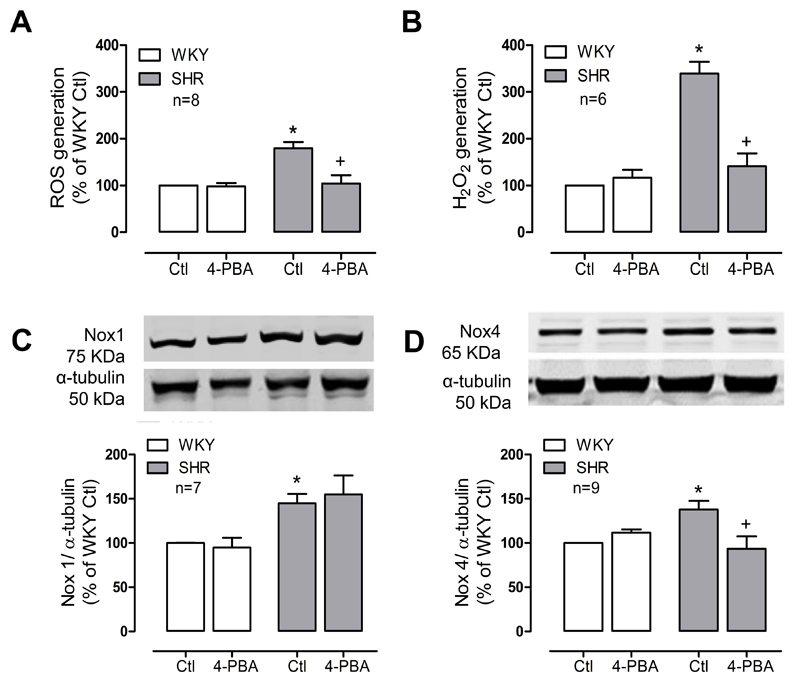
Figure 4. ER stress is involved in ROS generation in SHR VSMCs.
ROS generation was measured by chemiluminescence (A) and amplex red (B) in the presence of the chemical chaperone 4-PBA (1mmol/L, 24h). Nox1 (C) and Nox4 (D) expression in the presence of 4-PBA was assessed by western blot. Protein quantification was normalized by α- tubulin. Results are expressed as mean±SEM of 6-9 separate experiments. *p<0.05 vs WKY Ctl, and +p<0.05 vs SHR Ctl.

