
Figure 6. Roles of doxorubicin and IL-12 in boosting the intratumoral infiltration of infused T cells.
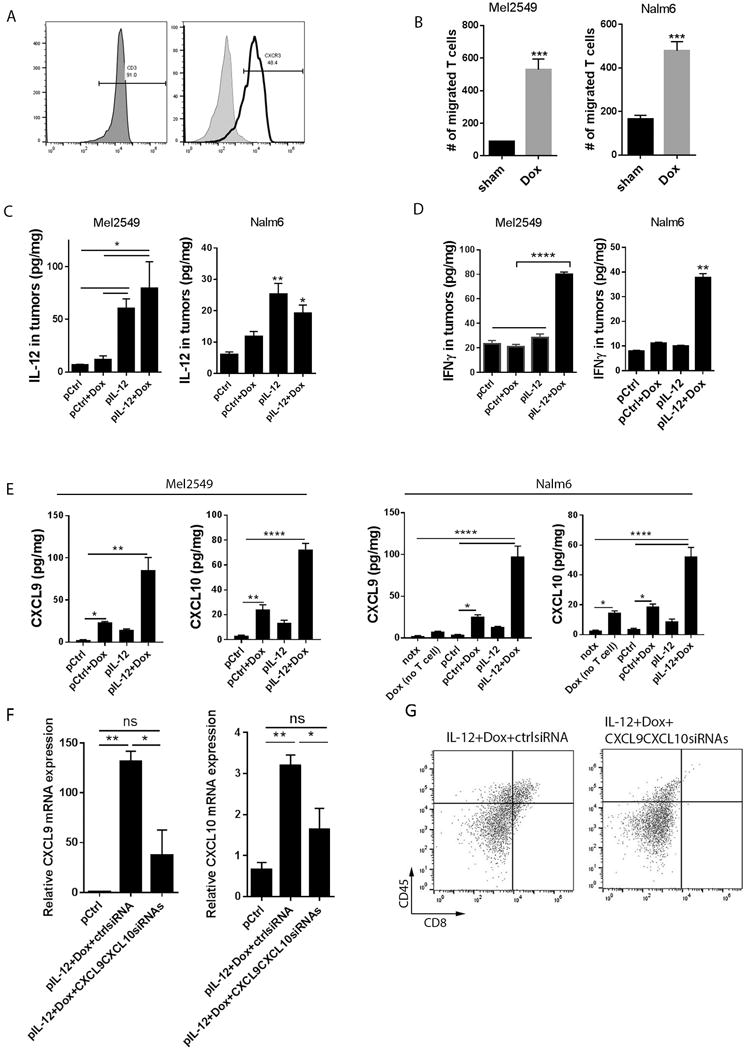
(A) Expression of CXCR3 on human CAR-T cells before infusion. Human CAR-T cells were subjected to CD3 and CXCR3 staining for flow cytometry analyses. (B) Migration assay of T cells and doxorubicin-treated tumor cells in Boyden transwell chambers. Tumor cells were pretreated with 100 nM doxorubicin or vehicle control for 72 hours, and one of the conditioned media was placed in the bottom chamber of each transwell. T cells were labeled with violet cell tracker and placed in the top chamber of each well, which had 5-μm pores. Ninety minutes later, cells in the bottom chambers were counted via flow cytometry analyses. Bar graphs show the numbers of migrated T cells as means ± SEM. (C, D, E) Murine and human xenograft tumors from each treatment group were subjected to lysis in RIPA buffer. The tumor lysates were subjected to ELISA assay to detect IL-12 (C), IFNγ (D) as well as CXCL9 and CXCL10 levels (E). notx, no treatment; Dox (no T cells), doxorubicin treatment without T cell infusions. Bar graphs show the concentration of indicated proteins per milligram of total proteins in the tumor as means ± SEM. (F,G) LLC tumor-bearing mice (N=3) were treated with IL-12 plus doxorubicin as described in Fig. 1 and were then subjected to intratumoral injection of control siRNA or CXCL9 siRNA plus CXCL10 siRNA followed by electroporation delivery twice a week. (F) Quantities of CXCL9 and CXCL10 mRNA (by PCR) in tumors. Bar graphs show the relative mRNA expression normalized to the control DNA-treated group as means ± SEM. (G) Flow cytometry of CD45+CD8+ cells in tumors. All results are representative of three repeated experiments.