
Figure 4. Genetic landscape of tumors from enrolled patients.
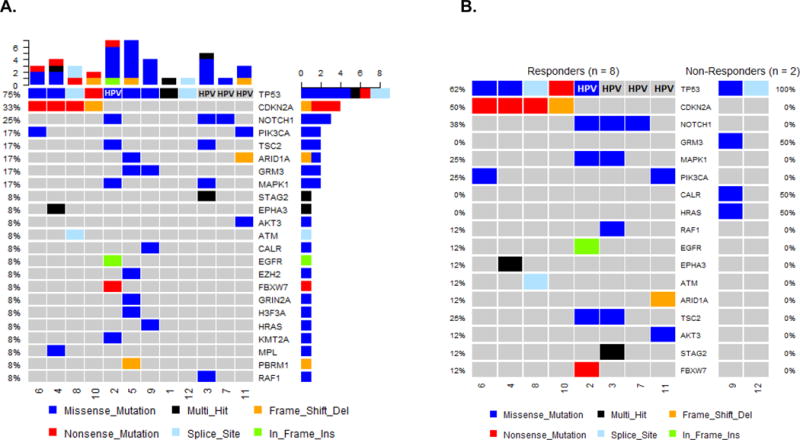
(A) Schematic representation (Oncoplot) of most commonly mutated genes and HPV status in all patients enrolled. Each column represents a patient. Colors depict the type of mutations for each gene. (B) Oncoplot comparison between responders vs. non-responders by RECIST criteria adjusted by histological responses as classified for the pharmakodynamic analysis.