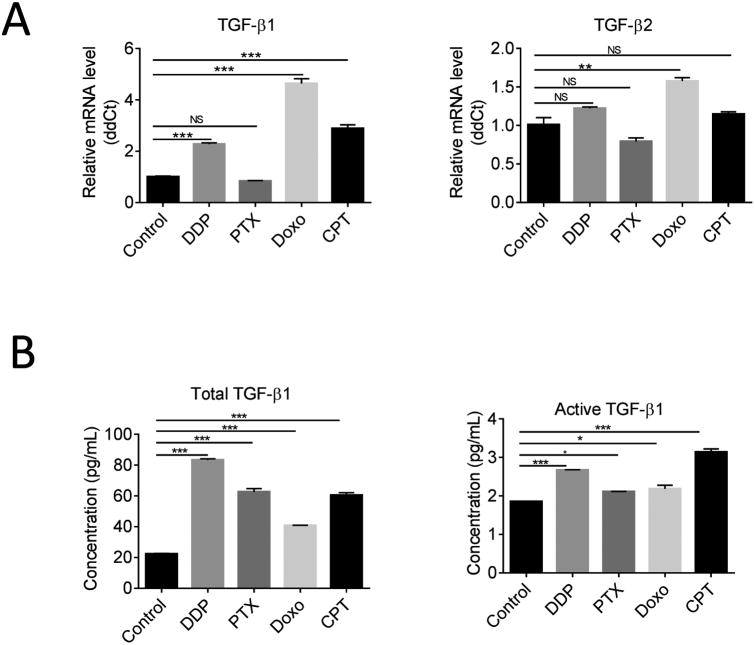
Figure 6.
Stimulation of TGF-β1 production and secretion in OVCAR-3 cells by chemotherapeutics. (A) qRT-PCR analysis for TGF-β1 and TGF-β2 mRNA expression in OVCAR-3 cell line after treatment with 10 μM DDP, 10 nM PTX, 100 nM Doxo, or 250 nM CPT for 24h. (B) ELISA assay of total TGF-β1 and active TGF-β1 secreted in OVCAR-3 cell conditioned medium. OVCAR-3 cell lines were plated in 6-well plates and treated with or without the indicated drugs for 24 hours in a serum-free medium. The medium was then collected for the measurements of total and active forms of TGF-β1 with a sandwich ELISA kit from R&D Systems. Data presented are mean ±SEM. *P<0.05; ** P< 0.01; *** P< 0.001 with one-way ANOVA and Tukey-Kramer post hoc test.

