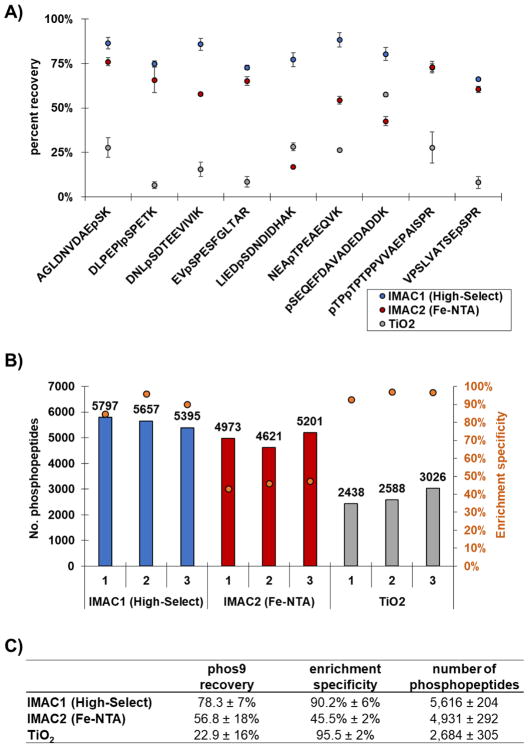
Figure 3. Evaluation of phosphorylated peptides identified by each enrichment method.
A) The dot plot illustrates the efficiency of recovery (peak area ratio of TMTzero to TMTsh) for phos9 phosphopeptides. Error bars represent standard error of the mean (s.e.m.) for three independent replicate samples. B) The bar plot illustrates the total number of phosphorylated peptides identified by each method. The overlaid orange circles represent the enrichment specificity (percentage of peptides that are phosphorylated) for each method. C) The table summarizes the findings for the phos9 peptide cocktail (mean ± SD).

