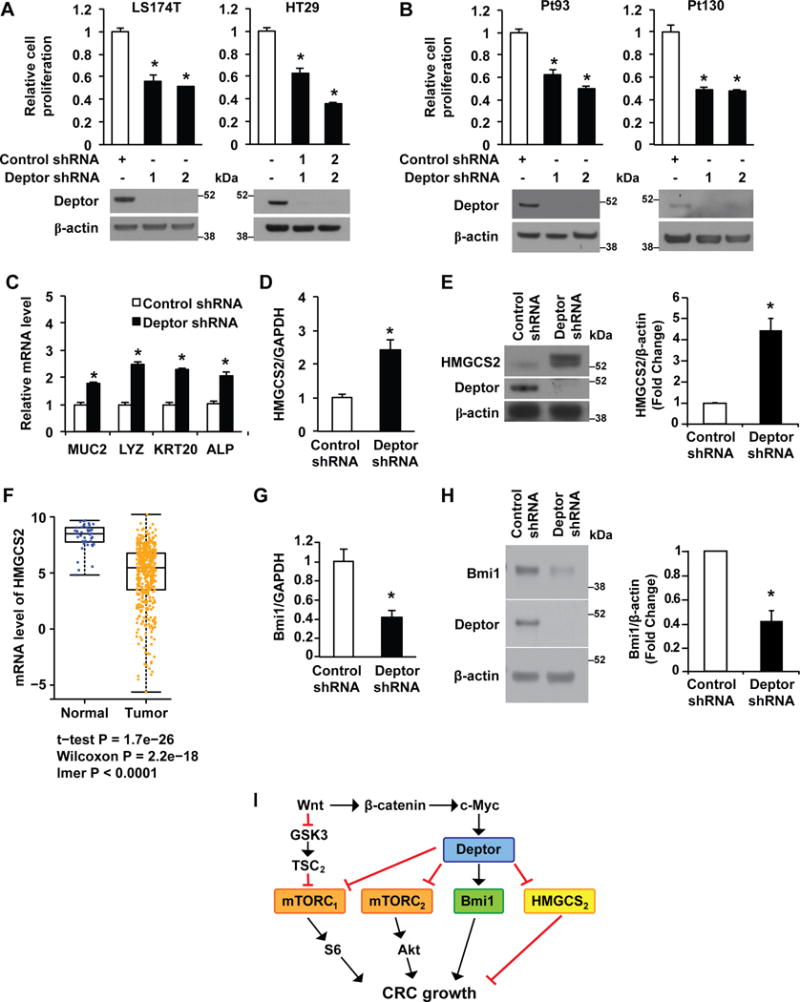
Figure 7. Deptor contributes to CRC cell growth.

A&B. Knockdown of Deptor decreases the proliferation of CRC cells. LS174T, HT29 (A) and primary human CRC cells (pt93 and pt130) (B), stably transfected with control shRNA or Deptor shRNA, were seeded into 6-well plates. After incubation for 72 h, cell numbers were counted. (n=3, data represent mean ± SEM; *P<0.01 vs control shRNA). Data are from one of three independent experiments with similar results. C-E. Knockdown of Deptor induces differentiation in LS174T cells. Total RNA (C&D) or protein (E) was extracted from LS174T cells, stably transfected with control or Deptor shRNA. mRNA levels of differentiation markers MUC2, LYZ, KRT20 and ALP (C), and HMGCS2 (D) were determined by real time RT-PCR. (n=3, data represent mean ± SEM; *P<0.01 versus control shRNA). Data are from one of three independent experiments with similar results. HMGCS2 protein levels were determined by western blot analysis (E). The images are representative of three independent experiments. HMGCS2 signals from three separate experiments were quantitated densitometrically and expressed as fold change with respect to β-actin. (n= 3, data represent mean± SEM; *P<0.01 versus control shRNA). F. Box plots show the mRNA levels of HMGCS2 in CRC tissues (n.456) and normal tissues (n.41). Data were obtained from the TCGA dataset. G&H. Knockdown of Deptor inhibits Bmi1 expression in LS174T cells. Total RNA or protein was extracted from LS174T cells, stably transfected with control or Deptor shRNA. mRNA levels of Bmi1 (G) were determined by real time RT-PCR. (n=3, data represent mean ± SEM; *P<0.01 versus control shRNA). Data are from one of three independent experiments with similar results. Bmi1 protein levels (H) were determined by western blot analysis (left panels). The images are representative of three independent experiments. Bmi1 signals from three separate experiments were quantitated densitometrically and expressed as fold change with respect to β-actin (right panels). (n= 3, data represent mean±S.D.; *P<0.01 versus control shRNA). I. Model proposed to explain the regulation and the role of Deptor in CRC cell growth.
