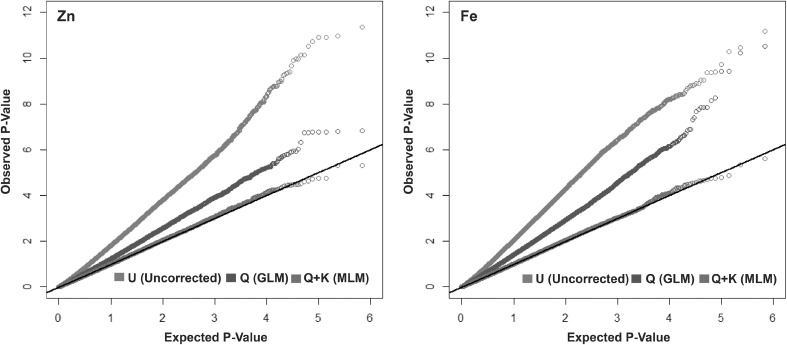
Fig. 1.
Quantile–quantile (Q–Q) plots showing inflation of estimated − log10 (P) values versus observed for traits Zn and Fe using uncorrected association model (U), Q (GLM) and Q + K (MLM). Q ten principal components (fixed), K kinship matrix (random), GLM general linear model, MLM mixed linear model

