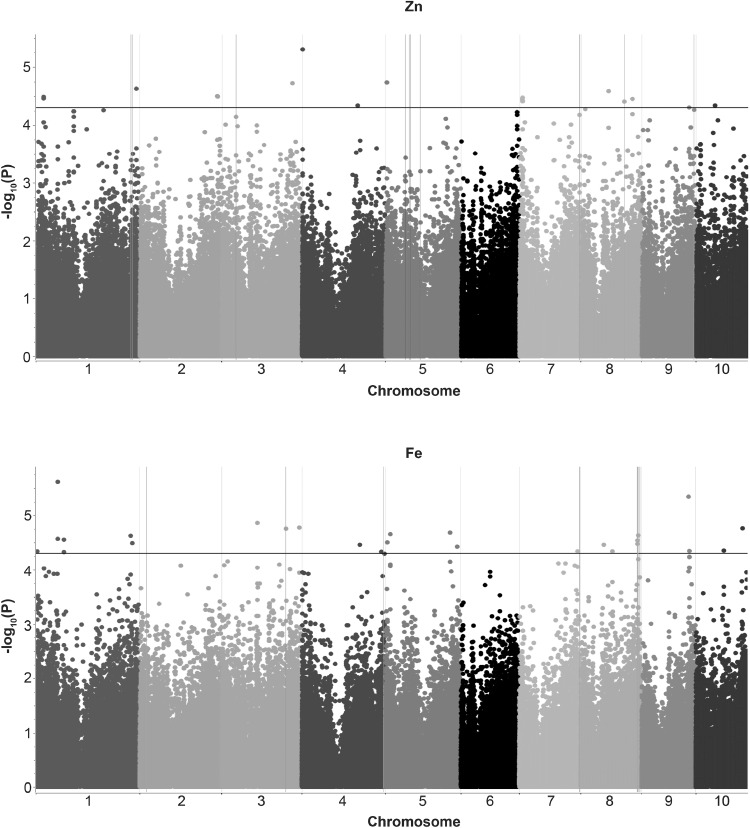
Fig. 2.
Manhattan plot from the Q + K (MLM) model for Zn and Fe, plotted with the individual SNPs of all chromosomes on the X-axis and − log10 P value of each SNP in the Y-axis. The different colors indicate the 10 chromosomes of maize. The black horizontal line shows the multiple testing threshold − log10 P value of 4.3 for this panel. The blue vertical lines show the associated SNPs validated in bi-parental populations

