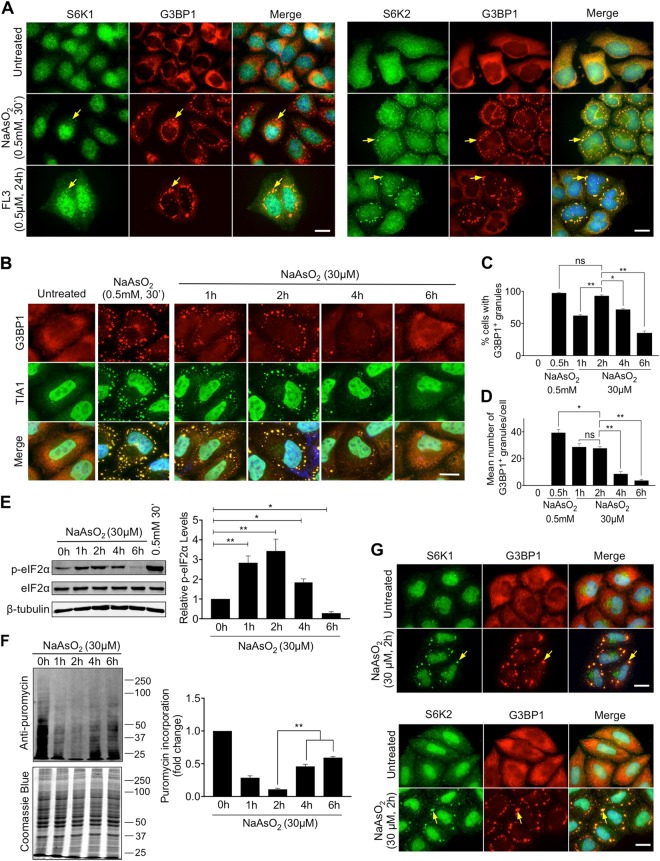
Fig. 1.
S6 kinases accumulate in stress granules. a HeLa cells were treated with either 0.5 mM of NaAsO2 for 30 min or 0.5 μM FL3 for 24 h and stress granules labelled using an antibody against G3BP1 (red). The localisation of S6K1 and S6K2 were observed by immunofluorescence staining (green). Nuclei were stained with DAPI (blue). Merged images are shown. Yellow arrows indicate examples of stress granules. Scale bar = 25 μm. b HeLa cells were treated with either 0.5 mM of NaAsO2 for 30 min or 30 μM NaAsO2 for 1, 2, 4 or 6 h. Stress granule formation was assessed by immunofluorescence staining of G3BP1 (red) or TIA1 (green). c, d Quantification of the % of cells containing stress granules after treatment and the mean number of stress granules in the cells displaying stress granules. 100 cells were counted in each of the 3 biological repeats. Scale bar = 20 μm. e HeLa cells were treated with either 0.5 mM of NaAsO2 for 30 min or 30 μM NaAsO2 for 1, 2, 4 or 6 h and protein extracts immunoblotted for phosphorylated eIF2α (p-eIF2α), eIF2α and β-tubulin. Quantification was performed from three independent experiments. f HeLa cells were treated with 30 μM NaAsO2 for 1, 2, 4 or 6 h. In the last 5 min of treatment, cells were incubated with 5 μg/ml puromycin. Incorporation of puromycin into newly synthesised protein was assessed by immunoblotting. Band intensities for each lane were measured in the biological repeats and normalised against intensity of Coomassie Blue staining. For c–f, error bars are s.e.m and the data were analysed using one-way Anova (*p < 0.04; **p < 0.0002). g HeLa cells were treated with 30 μM NaAsO2 for 2 h and stress granules were observed by immunofluorescence staining of G3BP1 (red). The distribution of S6K1 and S6K2 were analysed by immunostaining (green). Yellow arrows indicate examples of stress granules. Nuclei were stained with DAPI (blue). Scale bar = 25 μm

