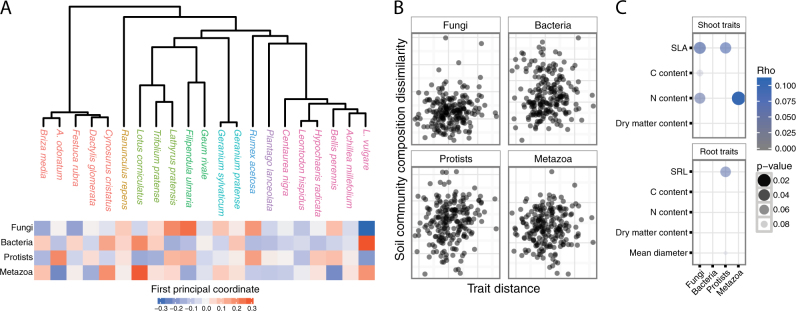
Fig. 2.
Relationships between plant species’ relatedness and differences in the composition of soil communities. Panel a shows a plant phylogenetic tree with species names colored by family (key shown in Fig. 1) with the corresponding heatmap showing the dissimilarities in the composition of each soil community. Colors represent the first principal coordinate analysis axis calculated from Bray–Curtis dissimilarities (a). The relationship between differences in the composition of soil communities and plant trait distances (b). Euclidean trait distances were calculated using all the traits shown in panel c. The relationship between differences in the composition of soil communities and individual plant traits (c). Points represent Spearman correlation coefficients (rho) and Mantel test results (P-value)

