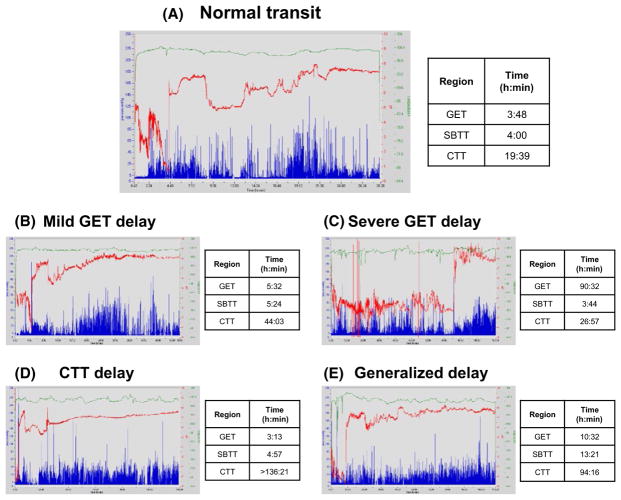
FIGURE 1.
Representative WMC recordings from patients with (A) normal transit throughout, (B) mildly delayed GET, (C) severely delayed GET, (D) delayed CTT, and (E) generalized GET, SBTT, and CTT delays are shown (normal GET ≤5 h, normal SBTT ≤6 h, normal CTT ≤58:45 h). Transit times are calculated from pH transitions (red tracings) and temperature changes (green tracings). Pressure recordings are shown in blue

