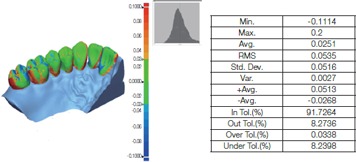
Table 2. Superposition of CRM and CTM of a model produced using 3D printing.
| 3D comparison of group B | ||
|---|---|---|
| Code | RMS value (μm) | Representative image |
| B-1 | 45.4 |  |
| B-2 | 66.7 | |
| B-3 | 41.4 | |
| B-4 | 46.3 | |
| B-5 | 54.8 | |
| B-6 | 58.9 | |
| B-7 | 58.5 | |
| B-8 | 58.8 | |
| B-9 | 54.4 | |
| B-10 | 35.6 | |
CRM, computer-aided design (CAD) reference model; CTM, CAD test model; RMS, root mean square value
