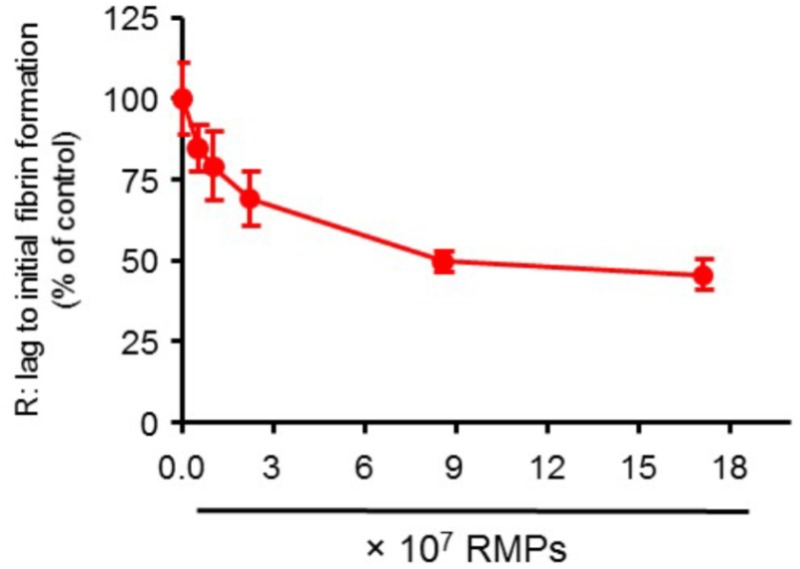
FIGURE 3.

Dose response curve showing the effect of variable RMP counts on R: lag time to initial fibrin formation. N = 20, 9, 8, 10, 10, and 20 for zero, 0.51 × 10⁷, 1.03 × 10⁷, 2.23 × 10⁷, 8.57 × 10⁷, and 17.1 × 10⁷ particles/mL groups, respectively. Results are presented as mean ± SEM.
