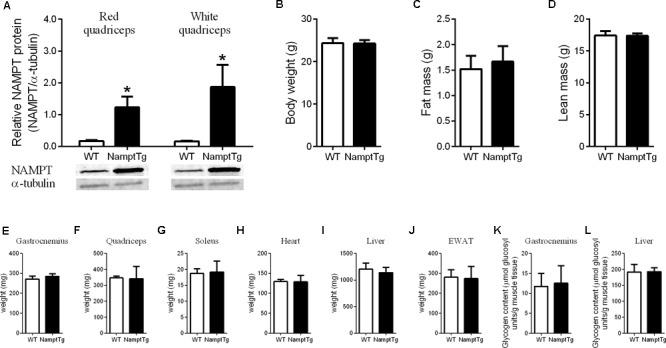
FIGURE 1.

Nampt protein content, body weight and composition, and tissue weight following voluntary exercise training. (A) Western blot analysis of NAMPT protein content in red and white quadriceps muscle; (B) body weight; (C) fat mass; (D) lean mass; (E) gastrocnemius tissue weight; (F) quadriceps tissue weight; (G) soleus tissue weight; (H) heart tissue weight; (I) liver tissue weight; (J) epidydimal white adipose tissue (EWAT) tissue weight; (K) gastrocnemius glycogen content; (L) liver glycogen content in NamptTg and WT mice following voluntary exercise training. ∗p < 0.05 NamptTg vs. WT.
