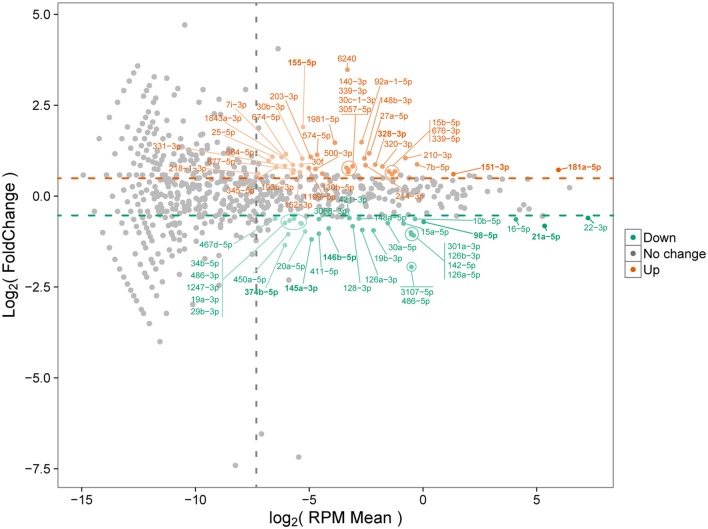
Figure 2.
MA plot of differentially expressed microRNAs (miRNAs). Differential miRNA expression between control and infected macrophages is shown. Upregulated and downregulated miRNAs in infected samples compared with controls are indicated. Only miRNAs with at least 200 reads in each sample were considered. Orange and green circles represent upregulated and downregulated miRNAs, respectively. Horizontal dashed lines represent the upper and lower limits of at least 1.5 fold-change. Vertical dashed line shows the normalized miRNA expression corresponding to 200 reads per sample.

