
Figure 7.
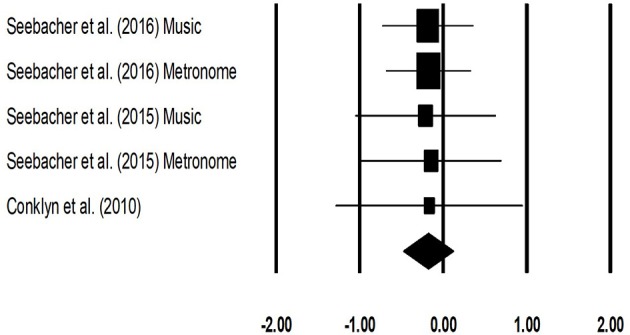
Forest plot illustrating individual studies evaluating the effects of rhythmic auditory cueing, on Timed 25 feet walking (seconds) test for patients with multiple sclerosis. Weighted effect sizes; Hedge's g (boxes) and 95% C.I (whiskers) are presented, demonstrating repositioning errors for individual studies. The (Diamond) represents pooled effect sizes and 95% CI.