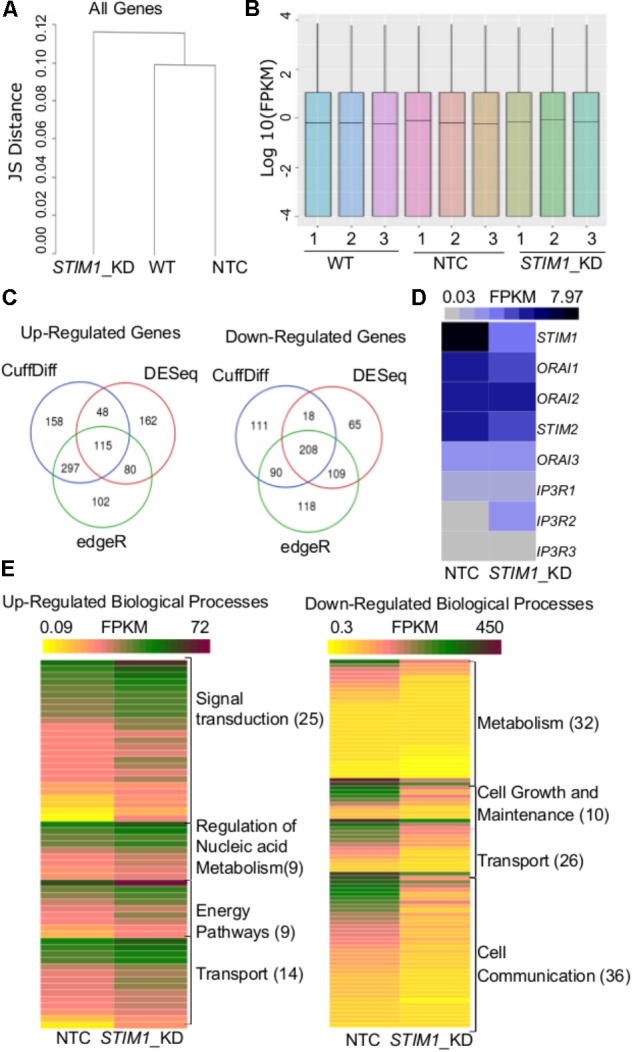
FIGURE 3.

Transcriptome analysis reveals global level changes in NPCs on STIM1 knockdown. (A) A dendrogram of Jensen–Shannon divergences analyzing the pattern of gene expression between wild type, NTC and STIM1 knockdown NPCs. Hierarchical clustering showing the STIM1 knockdown cells to form a separate cluster. (B) Box plots indicating the distribution of reads across all the samples sequenced. (C) Venn Diagrams representing the number of up and downregulated genes in the STIM1 knockdown NPCs. Genes were tested for differential expression according to Cuffdiff (blue), DESeq (red), and edgeR (green), intersection of genes that were considered differentially transcribed in comparison to control cells were used for further analysis. (D) Normalized read counts of the differentially expressed genes involved in SOCE in NTC and STIM1 knockdown conditions represented as a heat map; FPKM – Fragments Per Kilobase per Million reads (∗∗p = 0.006; two-tailed t -test). (E) Functional gene enrichment analysis performed in FunRich with genes in the intersection (115 upregulated and 208 downregulated) showing biological processes which are differentially regulated in the STIM1 knockdown NPCs based on FPKM values. The number in parentheses represents the number of genes associated with each process in the data set. Three biological replicates per condition were run for RNA-Seq.
