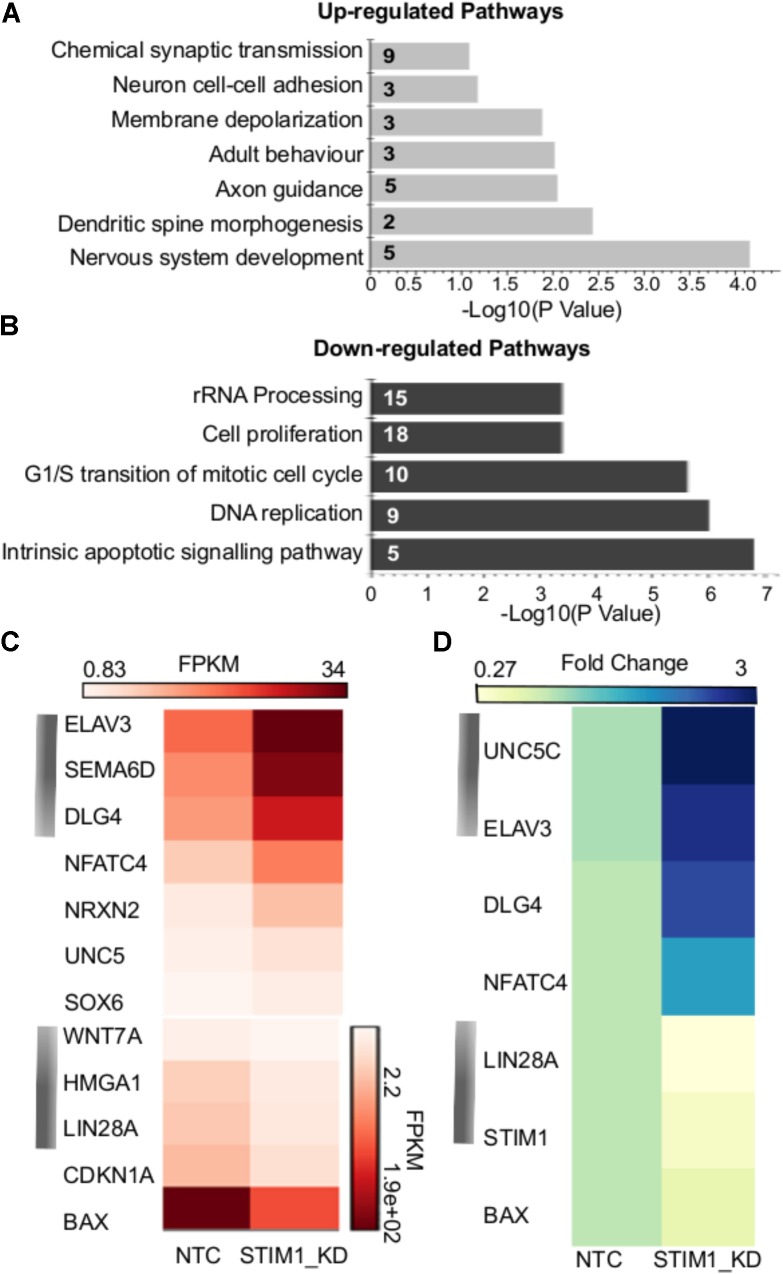
FIGURE 4.
Biological pathways affected by STIM1 knockdown in NPCs. Genes that were differentially expressed between NPCs with or without STIM1 knockdown were identified using an enrichment analysis using the DAVID web server. (A) Gene-GO term enrichment analysis by DAVID highlighting the most relevant up-regulated biological pathways based on the gene IDs, Each bar represents the Fisher Exact P -Value associated with the corresponding enriched pathway and the number in each bar denotes the number of genes involved in each pathway. (B) GO terms downregulated in the STIM1 knockdown NPCs based on the gene IDs. Each bar represents the Fisher Exact P -Value associated with the corresponding enriched pathway and the number in each bar denotes the number of genes involved in each pathway. (C) Heat map representing normalized read counts of some of the differentially expressed genes in the control and STIM1 knockdown NPCs. (D) Heat map representing fold changes of the indicated genes, as validated by qPCR (p < 0.05). Four independent samples were used for validation of the RNA-Seq using RT-PCR. FPKM, Fragments Per Kilobase per Million reads.

