FIGURE 5.
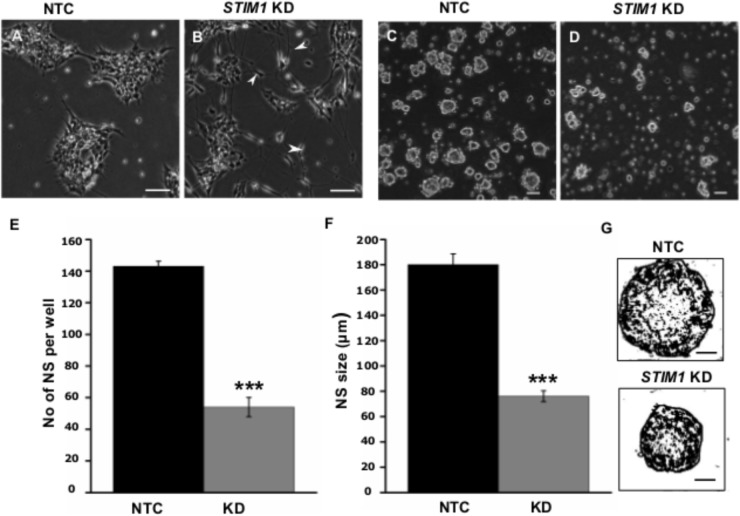
STIM1 knockdown represses proliferation of NPCs. (A) Control (NTC transduced) cells expressing ZsGreen. (B) STIM1 knockdown NPCs undergo spontaneous differentiation as evident by the presence of neurite-like processes and branches. (C,D) Neurosphere forming assay (NSA) of NTC and STIM1 knockdown NPCs at 48 h. (E) Quantification of neurosphere (NS) numbers per well after a week of seeding NTC and STIM1 knockdown NPCs (n = 3, p = 0.0008). (F) Quantification of NS size in microns (μm) at day 7 (n = 4, p = 0.00067). (G) Skeletonized (ImajeJ) NS to show the size difference at day 7 of representative NTC and STIM1 knockdown NPCs. Scale bar-50 μm (A–D), 20 μm (G).

