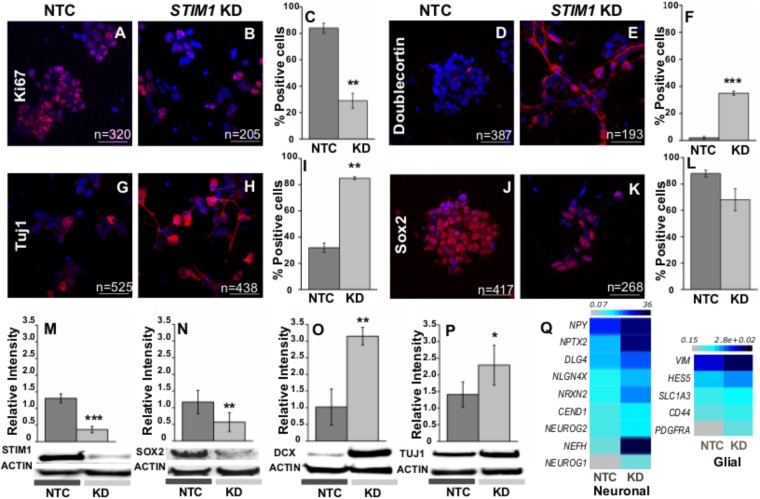
FIGURE 6.
STIM1 knockdown in NPCs promotes early neural differentiation. Immunostaining and western blot analysis of multipotent and differentiation markers. The cells were counterstained with DAPI for counting the immunopositive cells. (A,B) Immunostaining of the control and STIM1 knockdown NPCs for the proliferation marker Ki-67 and (C) its quantification as shown in the graph (p = 0.0043). (D,E) Expression of Doublecortin (DCX) a marker of newly born neurons in the NTC and STIM1 knockdown NPCs and (F) its quantification as shown in the graph (p = 1.67 × 10⁻⁴). (G,H) Neuron-specific Class III β-tubulin (Tuj1) in the NTC and STIM1 knockdown NPCs and (I) its quantification as shown in the graph (p = 0.0087). (J,K) Sox2, the multipotent neural stem cell marker the NTC and STIM1 knockdown NPCs and (L) its quantification as shown in the graph, not significant. Scale bar-50 μm. Total number of cells counted (n) as indicated in each panel. Western blot analysis showing (M) STIM1, p = 0.0006 (N) Sox2, p = 0.008 (O) DCX, p = 0.0056 (P) Tuj1 protein (p = 0.043) levels in the control and knockdown cells. (Q) Heat map representing normalized read counts of selected neuronal and glial genes which are upregulated in the STIM1 knockdown NPCs. N ≥ 3, t -test used for all significance tests. Asterisks indicate ∗∗∗p < 0.001, ∗∗p < 0.01, ∗p < 0.05.

