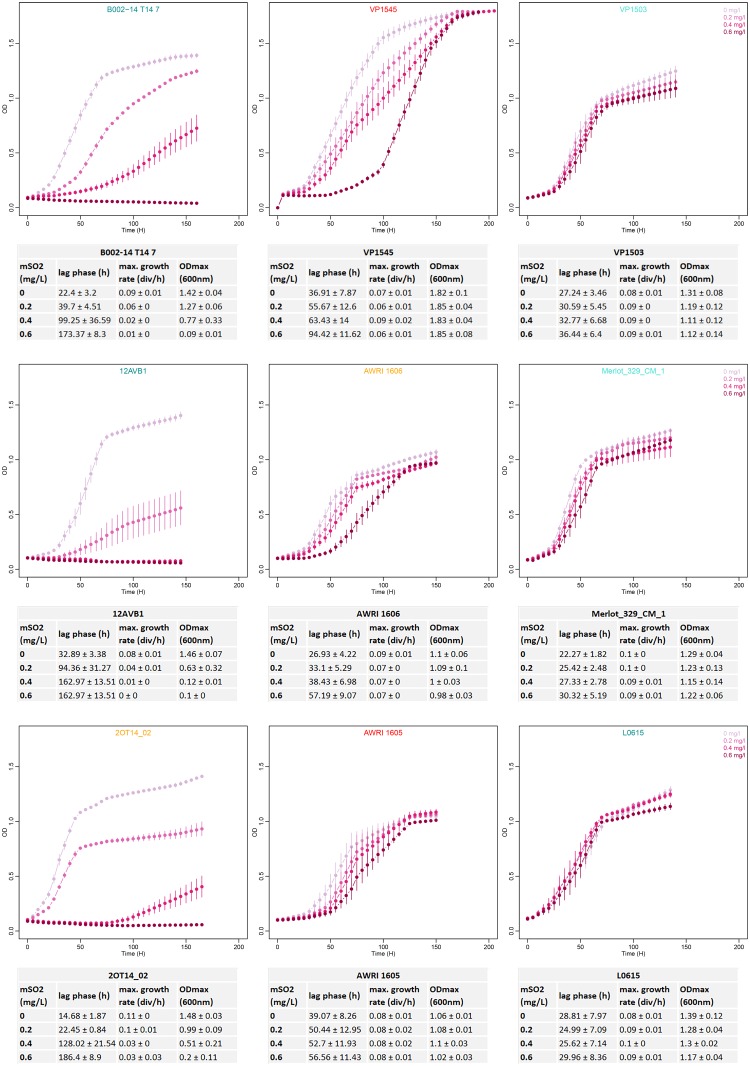
FIGURE 2.
Examples of B. bruxellensis sensitive, tolerant, and resistant behavior at four mSO2 concentrations. Strains B002-14 T14 7, 12AVB1, and 2OT14_02 represent sensitive strains. VP1545, AWRI 1606, and AWRI 1605 are tolerant isolates and VP1503, Merlot_329_CM_1, and L0615 are examples of resistant strains. Each curve is built using the mean of three to four replicates, and error bars represent standard deviations and curve colors correspond to increasing SO2 concentration (light pink 0 mg/L mSO2 to dark pink 0.6 mg/L mSO2). The estimated growth parameters (lag phase, maximal growth rate, and maximal OD) are shown below each curve, with mean ± standard deviation.

